DEM Sepia Visualization
//VERSION=3
// To set custom max and min values, set
// choose your max and min values.
// The color map will then be scaled
// to those max and min values
const max = 9000;
const min = -12000;

function setup() {
  return {
    input: ["DEM", "dataMask"],
    output: { bands: 4, sampleTYPE: "AUTO" },
  };
}

const map = [
  [9000, 0xff952c],
  [7000, 0xf9922c],
  [5000, 0xf5902b],
  [3000, 0xeb8929],
  [1000, 0xe08428],
  [500, 0xd67d25],
  [400, 0xc77522],
  [300, 0xb46a1f],
  [200, 0x9f5e1c],
  [50, 0x8b5218],
  [30, 0x824b16],
  [10, 0x6d4013],
  [0, 0x633911],
  [-10, 0x5a3510],
  [-20, 0x502e0e],
  [-50, 0x3b2209],
  [-200, 0x2c1a07],
  [-500, 0x221306],
  [-1000, 0x180e04],
  [-5000, 0x0f0702],
  [-9000, 0x050200],
  [-12000, 0x000000],
];

const visualizer = new ColorRampVisualizer(map, min, max);

function evaluatePixel(sample) {
  let val = sample.DEM;
  let imgVals = visualizer.process(val);

  // Return the 4 inputs and define content for each one
  return [...imgVals, sample.dataMask];
}
//VERSION=3
// To set custom max and min values, set
// choose your max and min values.
// The color map will then be scaled
// to those max and min values
const max = 9000;
const min = -12000;
function setup() {
return {
input: ["DEM", "dataMask"],
output: [
{ id: "default", bands: 4, sampleTYPE: "AUTO" },
{ id: "index", bands: 1, sampleType: "FLOAT32" },
{ id: "dataMask", bands: 1 },
],
};
}
const map = [
[9000, 0xff952c],
[7000, 0xf9922c],
[5000, 0xf5902b],
[3000, 0xeb8929],
[1000, 0xe08428],
[500, 0xd67d25],
[400, 0xc77522],
[300, 0xb46a1f],
[200, 0x9f5e1c],
[50, 0x8b5218],
[30, 0x824b16],
[10, 0x6d4013],
[0, 0x633911],
[-10, 0x5a3510],
[-20, 0x502e0e],
[-50, 0x3b2209],
[-200, 0x2c1a07],
[-500, 0x221306],
[-1000, 0x180e04],
[-5000, 0x0f0702],
[-9000, 0x050200],
[-12000, 0x000000],
];
const visualizer = new ColorRampVisualizer(map, min, max);
function evaluatePixel(sample) {
let val = sample.DEM;
let imgVals = visualizer.process(val);
// Return the 4 inputs and define content for each one
return {
default: [...imgVals, sample.dataMask],
index: [val],
dataMask: [sample.dataMask],
};
}Evaluate and Visualize
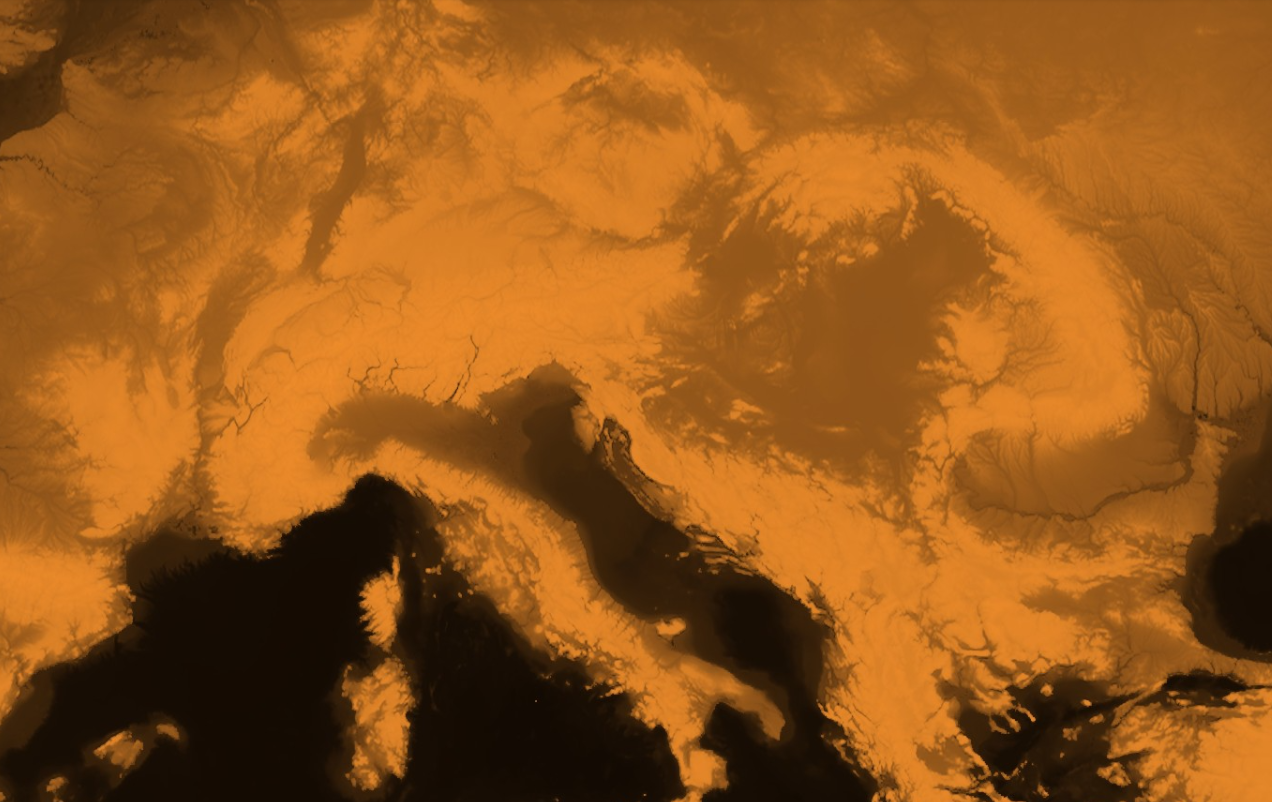
Description
This script returns a sepia visualization of a digital elevation model, assigning continuous colors to the elevation borders.
It is possible to set custom min and max values in the evalscript by setting defaultVis to false and setting the min and max variables to the desired values.