Global Surface Water Recurrence visualisation script
//VERSION=3

//This custom script visualises the water recurrence layer according to the data user guide.

//Set up input and output settings
function setup() {
  return {
    input: ["recurrence"],
    output: {
      bands: 3,
      sampleType: "AUTO"
    }
  }
}

//Create color ramp
const ramps = [
  [1, 0xff7f27],  //1% recurrence (Vivid orange)
  [100, 0x99d9ea] //100% recurrence (Very soft cyan)
];

//Create visualizer
const visualizer = new ColorRampVisualizer(ramps);

//EvaluatePixel function
function evaluatePixel(sample) {
  if (sample.recurrence == 0){  //Not water
    return [1, 1, 1]            //Return White
  }else if (sample.recurrence > 100){ //No data
    return [0.8, 0.8, 0.8]            //Return Light gray
  }else if (sample.recurrence > 0 && sample.recurrence <= 100){ //1 - 100% recurrence
    return [visualizer.process(sample.recurrence)[0], visualizer.process(sample.recurrence)[1], visualizer.process(sample.recurrence)[2]];  //Return color ramp values
  }
}General description of the script
This script visualizes the Recurrence layer from the Global Surface Water dataset according to the official symbology (Table 1). The Recurrence layer captures the degree of interannual variability in surface water presence. It shows how frequently water returned to a particular location between years in a defined water period within the entire time period.
Table 1: Recurrence Symbology
| Value | Symbol | Colour | Label |
|---|---|---|---|
| 0 | 0xffffff | Not water | |
| 1 | 0xff7f27 | 1% recurrence | |
| 100 | 0x99d9ea | 100% recurrence | |
| 255 | 0xcccccc | No data |
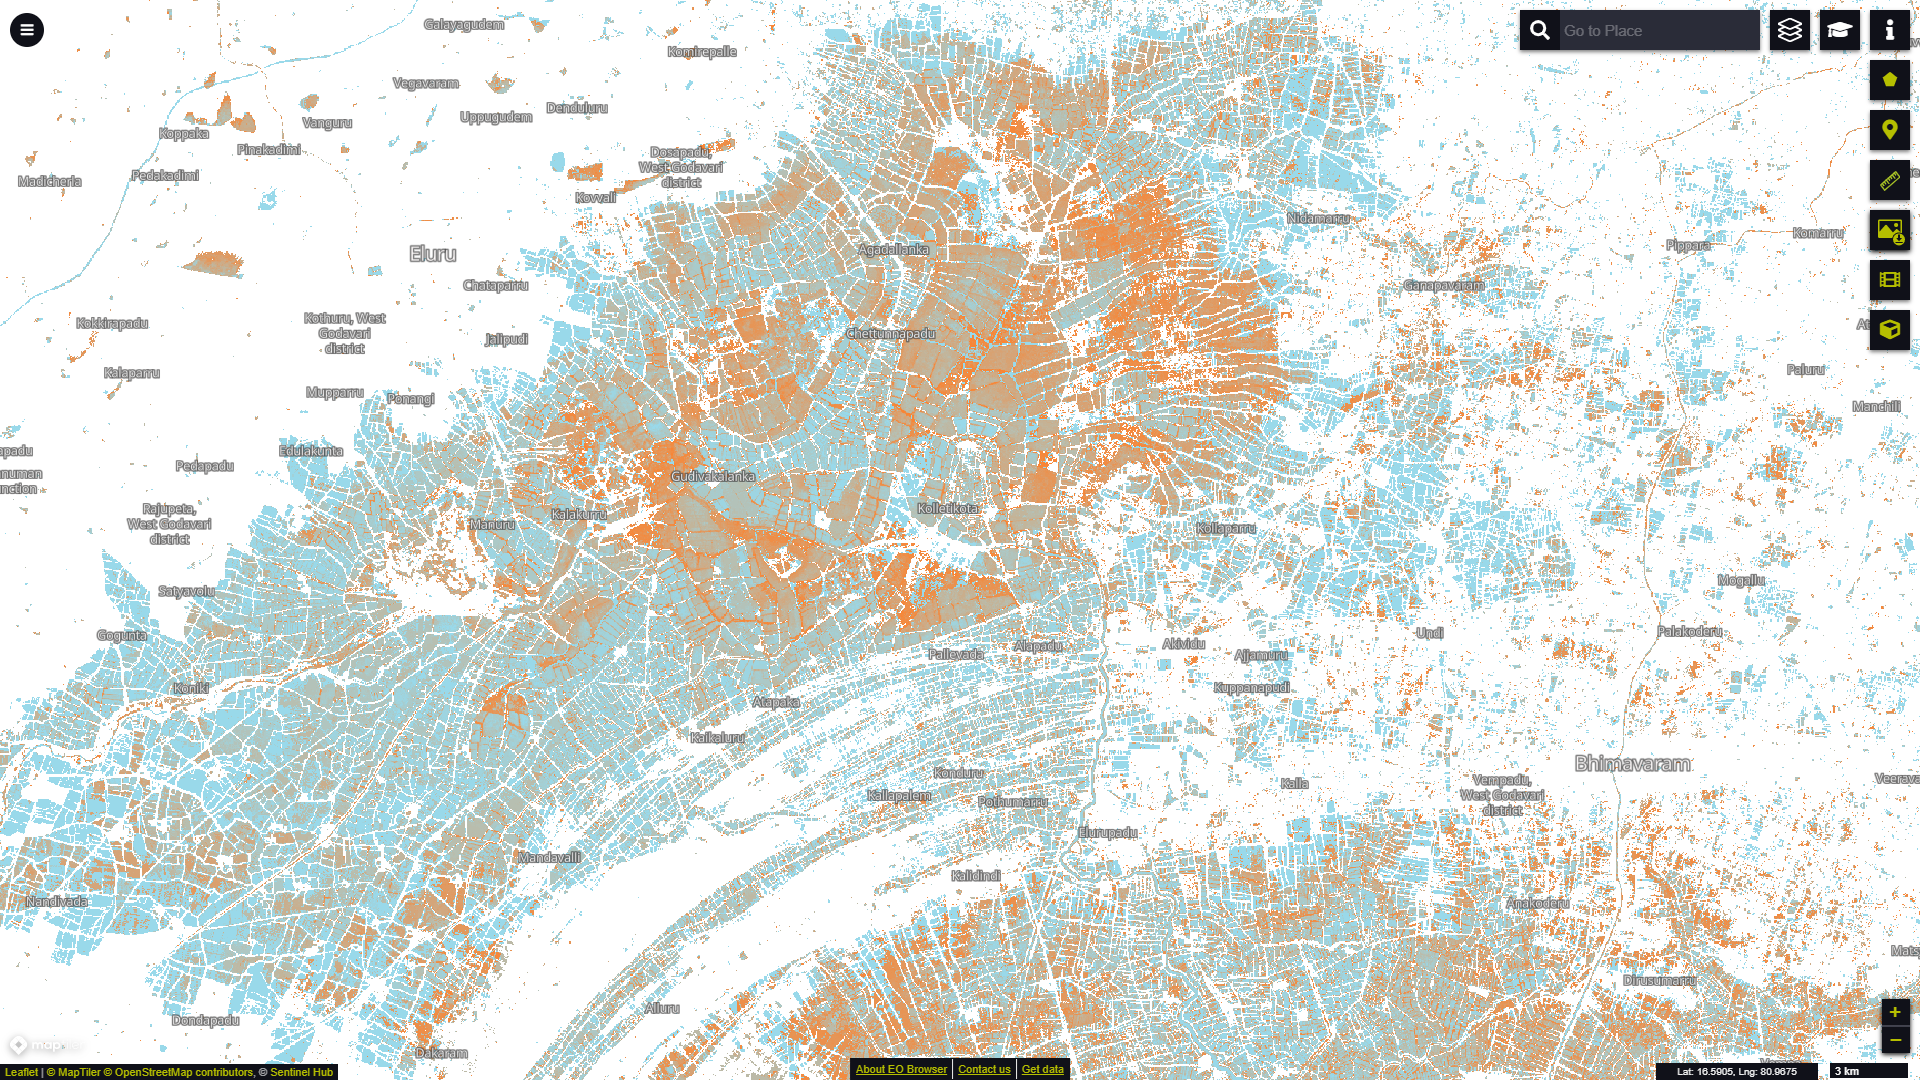
Description of representative images
Recurrence layer visualisation in EO Browser showing Paddy fields near the city of Eluru in West Godavari, India.