Canopy Cover, Forest Carbon Diligence
//VERSION=3
const defaultVis = true;
const max = 100;
const min = 0;

function setup() {
  return {
    input: ["CC", "dataMask"],
    output: { bands: 4, sampleTYPE: "AUTO" },
  };
}

function updateMap(max, min) {
  const numIntervals = map.length;
  const intervalLength = (max - min) / (numIntervals - 1);
  for (let i = 0; i < numIntervals; i++) {
    map[i][0] = max - intervalLength * i;
  }
}

const map = [
  [100, 0x183d19],
  [90, 0x124f24],
  [80, 0x0e6327],
  [70, 0x246d29],
  [60, 0x498418],
  [50, 0x669516],
  [40, 0x859e25],
  [30, 0xa4ab38],
  [20, 0xd3c058],
  [10, 0xddd17c],
  [0, 0xf0f5d5],
];

const visualizer = new ColorRampVisualizer(map, min, max);

function evaluatePixel(sample) {
  let val = sample.CC;
  let imgVals = visualizer.process(val);

  return [...imgVals, sample.dataMask];
}
//VERSION=3
// To set custom max and min values, set
// defaultVis to false and choose your max and
// min values. The color map will then be scaled
// to those max and min values
const defaultVis = true;
const max = 100;
const min = 0;
function setup() {
return {
input: ["CC", "dataMask"],
output: [
{ id: "default", bands: 4 },
{ id: "index", bands: 1, sampleType: "UINT8" },
{ id: "eobrowserStats", bands: 1, sampleType: "FLOAT32" },
{ id: "dataMask", bands: 1 },
],
};
}
function updateMap(max, min) {
const numIntervals = map.length;
const intervalLength = (max - min) / (numIntervals - 1);
for (let i = 0; i < numIntervals; i++) {
map[i][0] = max - intervalLength * i;
}
}
const map = [
[100, 0x183d19],
[90, 0x124f24],
[80, 0x0e6327],
[70, 0x246d29],
[60, 0x498418],
[50, 0x669516],
[40, 0x859e25],
[30, 0xa4ab38],
[20, 0xd3c058],
[10, 0xddd17c],
[0, 0xf0f5d5],
];
const visualizer = new ColorRampVisualizer(map, min, max);
function evaluatePixel(sample) {
let val = sample.CC;
let imgVals = visualizer.process(val);
return {
default: imgVals.concat(sample.dataMask),
index: [val],
eobrowserStats: [val],
dataMask: [sample.dataMask],
};
}//VERSION=3
function setup() {
return {
input: ["CC"],
output: { bands: 1, sampleType: "UINT8" },
};
}
function evaluatePixel(sample) {
return [sample.CC]
}Evaluate and visualize
As Forest Carbon Diligence is commercial data, brought into Sentinel Hub as Bring Your Own Data, direct EO Browser links are not possible due to the personalized data credentials.
General description
Canopy cover quantifies the percentage of area occupied by trees within a pixel, where a tree is defined as vegetation 5 meters or taller. This metric will be most sensitive to tree clearing events like timber harvest or deforestation, but is also sensitive to seasonal leaf-on variation and to drought.
The data layer has four bands:
- Canopy Cover quantifies the horizontal area occupied by tree canopies that are > 5m tall.
- Lower prediction bound (5th percentile) of the 90% prediction interval for model predictions at each pixel.
- Upper prediction bound (95th percentile) of the 90% prediction interval for model predictions at each pixel.
- Quality Assurance Flags describing the expected quality of satellite data measurements, and whether any temporal gap-filling was applied.
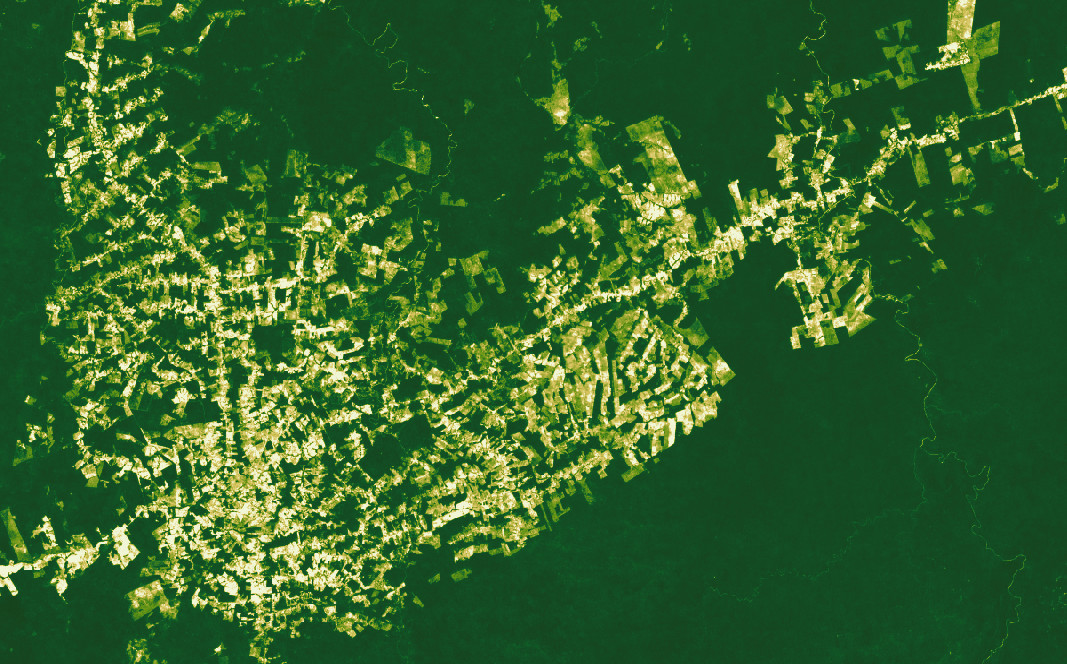
Description of representative images
Canopy Cover in 2022 near Apui, Brazil.