Radar Vegetation Index Code for Dual Polarimetric Script
/*
Radar Vegetation index for Sentinel-1
Subhadip Dey
IIT Bombay

This code is based on:
Nasirzadehdizaji, Rouhollah, et al. "Sensitivity Analysis of Multi-Temporal Sentinel-1 SAR Parameters to Crop Height and Canopy Coverage." Applied Sciences 9.4 (2019): 655.
*/
/// updated to version 3 by András Zlinszky and GitHub Copilot


function setup() {
    return {
        input: ["VV", "VH"],
        output: { bands: 3 }
    };
}

function evaluatePixel(sample) {
    let VV = sample.VV;
    let VH = sample.VH;

    // Calculate RVI

    let rvi = (4 * VH) / (VV + VH);

    // Return RVI as grayscale

    return [rvi, rvi, rvi];
}
/*
Radar Vegetation index for Sentinel-1
Subhadip Dey
IIT Bombay
This code is based on:
Nasirzadehdizaji, Rouhollah, et al. "Sensitivity Analysis of Multi-Temporal Sentinel-1 SAR Parameters to Crop Height and Canopy Coverage." Applied Sciences 9.4 (2019): 655.
*/
/// adapted by András Zlinszky for Sentinel-1 quarterly mosaics
function setup() {
return {
input: ["VV", "VH", "dataMask"],
output: [
{ id: "default", bands: 4 },
{ id: "index", bands: 1, sampleType: "FLOAT32" },
{ id: "eobrowserStats", bands: 1, sampleType: "FLOAT32" },
{ id: "dataMask", bands: 1 }
]
};
}
var water_threshold = 10; // Lower means more water
const rvi_min = -0.1; // Lower limit of the color ramp
const rvi_max = 1; // Upper limit of the color ramp
const num_steps = 9; // Number of steps in the ramp
// Define the colors for the ramp from light sand brown to deep fir green
const colors = [
[0.93, 0.91, 0.71], // Light sand brown
[0.87, 0.85, 0.61], // Sandy beige
[0.8, 0.78, 0.51], // Light tan
[0.74, 0.72, 0.42], // Golden brown
[0.69, 0.76, 0.38], // Olive green
[0.64, 0.8, 0.35], // Light moss green
[0.57, 0.75, 0.32], // Moss green
[0.5, 0.7, 0.28], // Forest green
[0.38, 0.59, 0.21] // Deep fir green
];
// Generate the ramp dynamically
const rvi_ramp = [];
const step_size = (rvi_max - rvi_min) / (num_steps - 1);
for (let i = 0; i < num_steps; i++) {
const value = rvi_min + i * step_size;
rvi_ramp.push([value, colors[i]]);
}
visualizer = new ColorRampVisualizer(rvi_ramp, rvi_min, rvi_max);
function evaluatePixel(samples) {
let VV = samples.VV;
let VH = samples.VH;
let dataMask = samples.dataMask;
// Calculate RVI
let rvi = (4 * VH) / (VV + VH);
rvi = Math.max(rvi_min, Math.min(rvi_max, rvi)); // Clamp to the range
// Apply water threshold
if (VV / VH >= water_threshold) {
return {
default: [0.7, 0.8, 0.9, 1.0], // Water color (light greyish blue)
index: [rvi],
eobrowserStats: [rvi],
dataMask: [dataMask]
};
} else {
// Get the color from the ramp
let color = visualizer.process(rvi);
return {
default: color.concat([dataMask]),
index: [rvi],
eobrowserStats: [rvi],
dataMask: [dataMask]
};
}
}Evaluate and Visualize
General description of the script
This script computes the vegetation indices over the scene using the VH and VV polarization combinations. It computes the 4 times normalized VH backscatter to compute the vegetation index. This code is based on Nasirzadehdizaji et al. (2019) work, where HH ~ VV was considered for dual polarization SAR data. This index could be useful for the identification of crop phenological stages. During the growth period the randomness in SAR backscatter increases as crop canopy distribution and density change. This index directly relates the changes in those crop parameters and the randomness in the SAR backscatter. Hence, variation in the index is found depending on the growth stage.
Details of the script
This index can be applied to retrieve the crop phenological stages and also for different crop type mapping. However, the bound of this index is from 0 to 4, where 0 means no vegetation coverage and 4 means 100% vegetation coverage. However, this index represents the randomness in SAR backscatter. Hence, prior information about field type, e.g. urban area, vegetation area or water body might be required if one is interested to monitor the temporal changes of some particular type of targets.
See the supplementary material for more details about the script.
Adaptation to Sentinel-1 mosaics
As Sentinel-1 mosaics provide a seamless and noise-reduced data source, they can also be used for visualizing Radar Vegetation Index. This script was modified to calculate the same spectral index, but provide a vegetation-oriented color ramp that can be tuned by the user to their local data range. It also includes a very rudimentary water classification by a simple threshold - this is prone to mistake bare soil as water.
Author of the script
Subhadip Dey, adapted to Sentinel-1 monthly mosaics by András Zlinszky and Github Copilot
Description of representative images
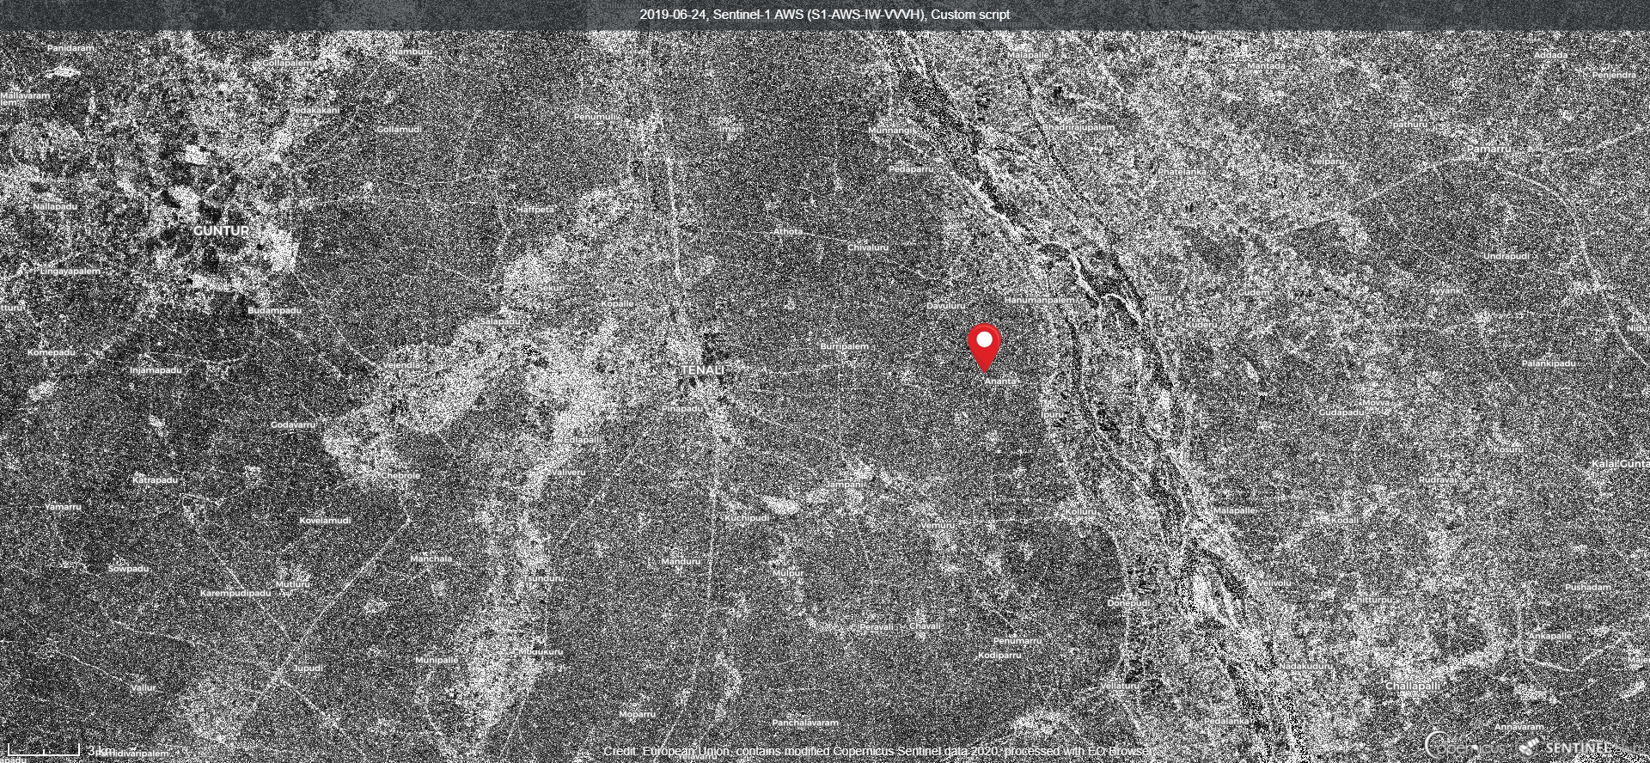
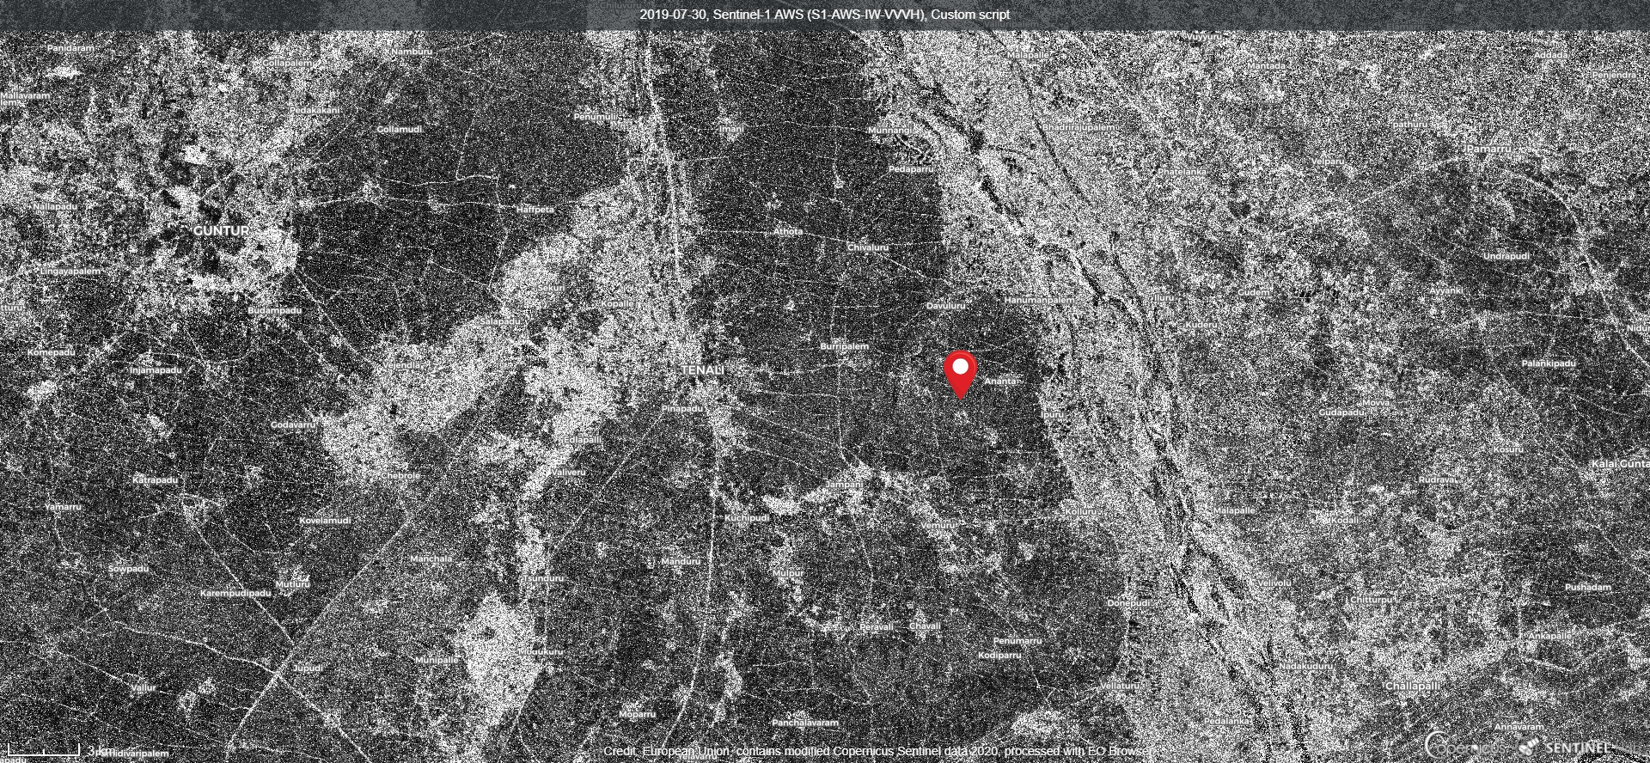
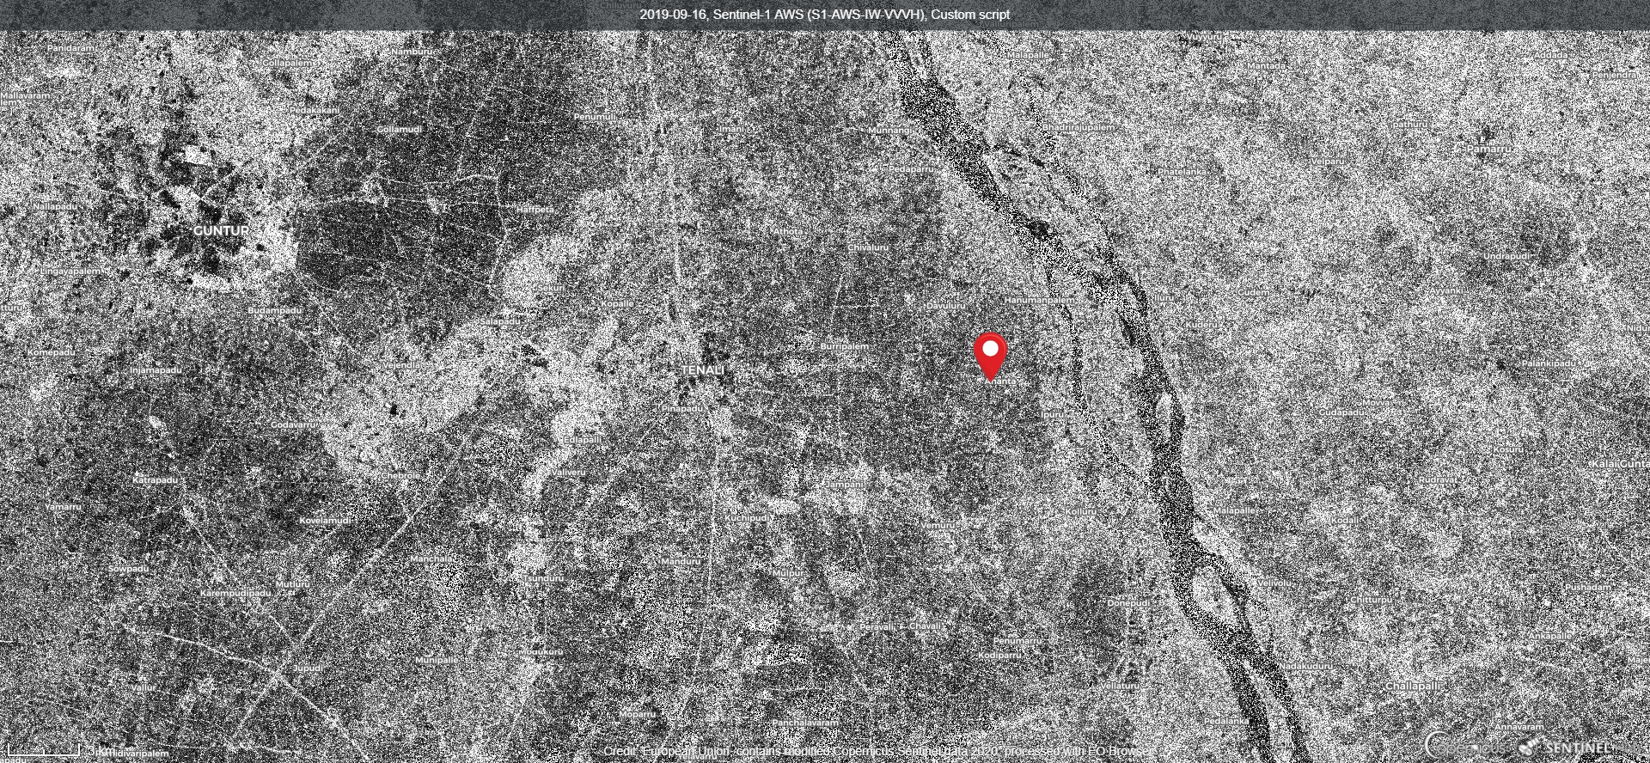
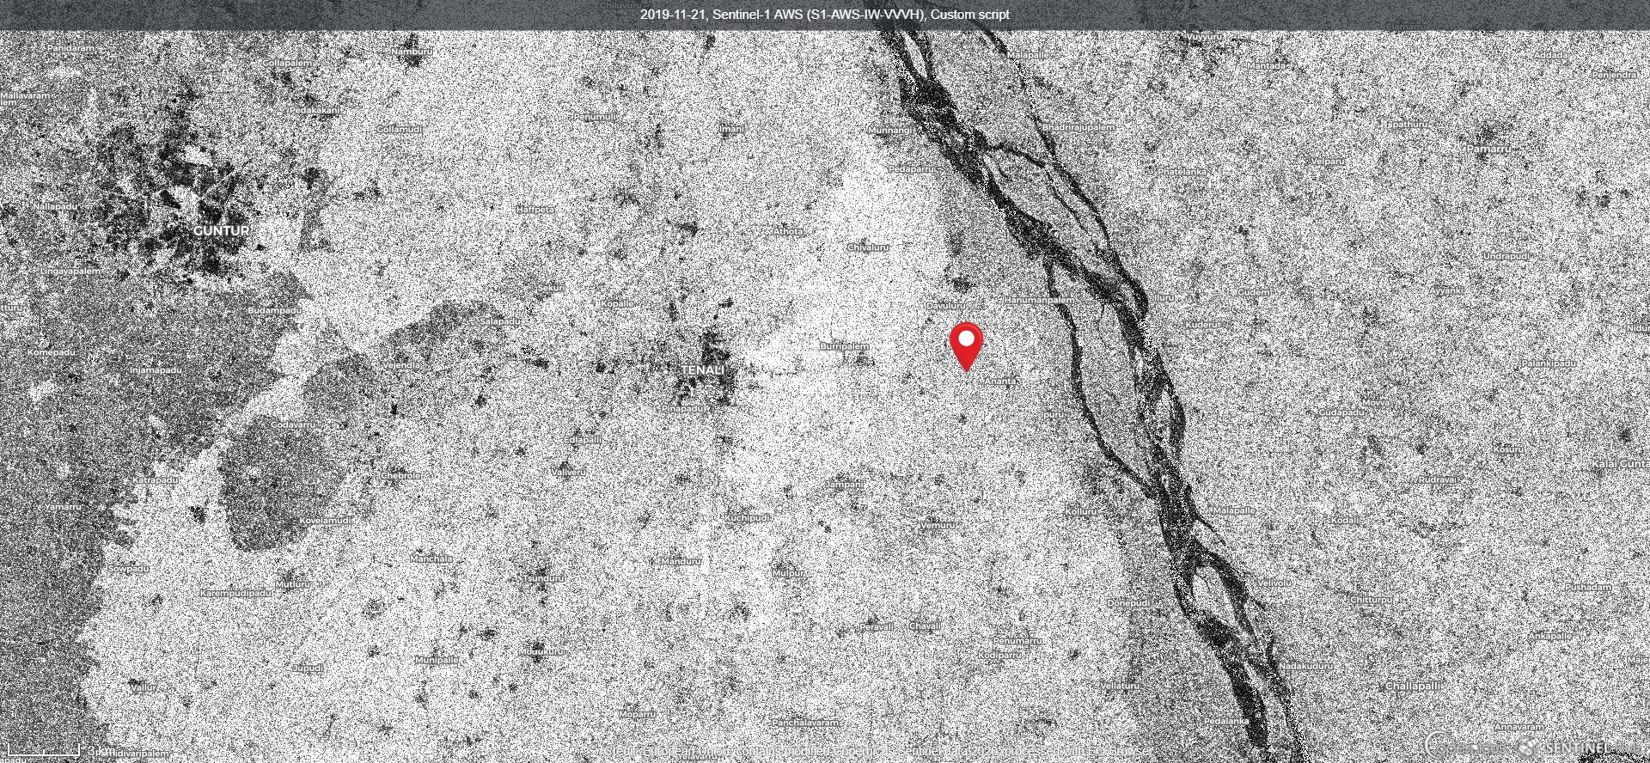
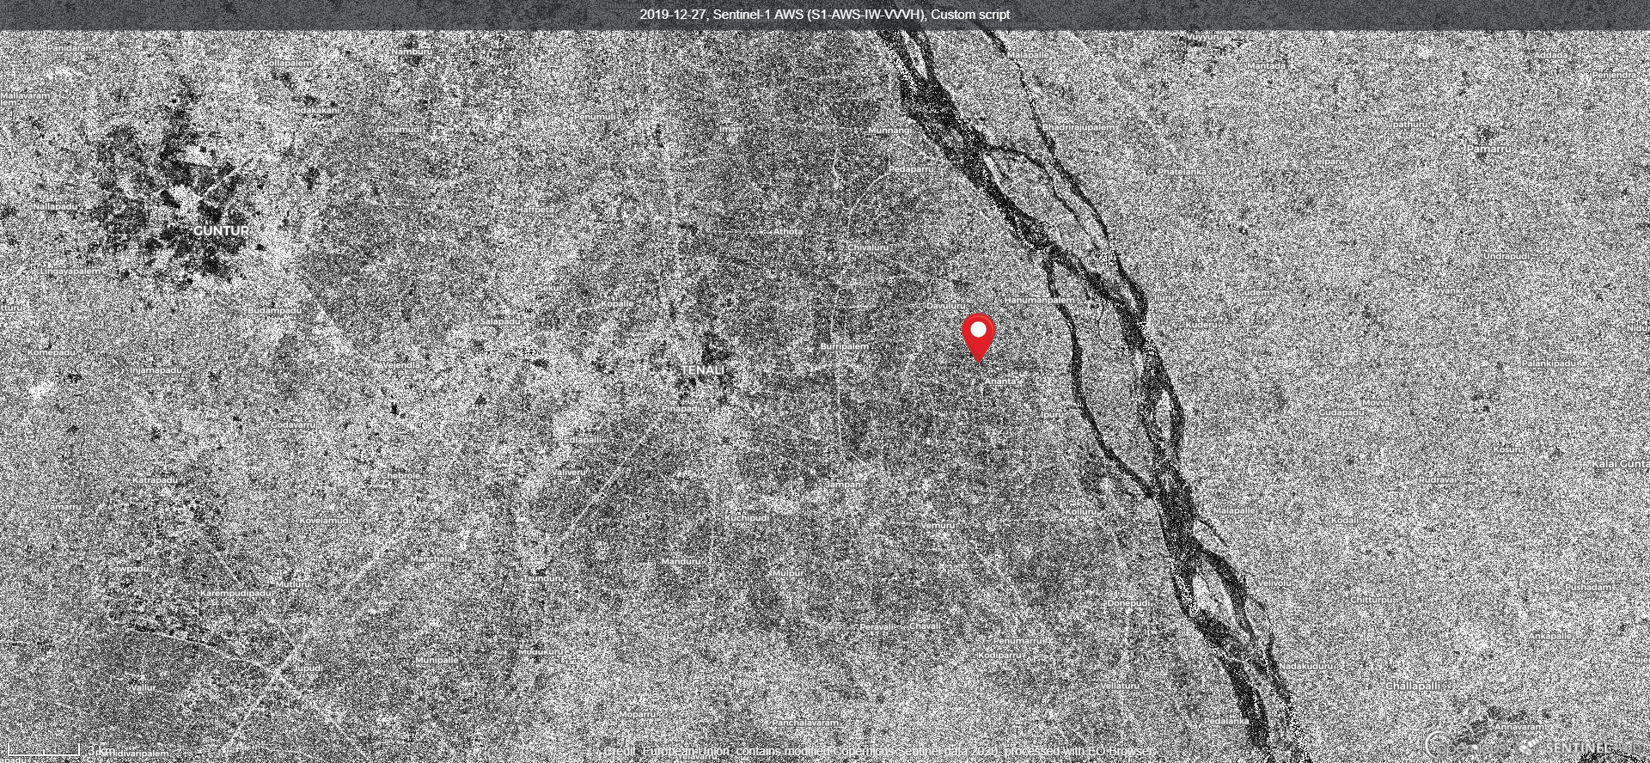
The representative images are over Vijayawada, India region. The period of the imaging was from 24-June, 2019 to 27-December, 2019. During this period, rice is majorly sown over all the fields in this area. Also, the monsoon cloudy climatic condition creates hindrance in ground data collection by optical satellites. In this regard, the Sentinel-1 SAR satellite could be an alternative way to monitor the rice phenological stages. It can be seen from the representative images that the RVI for Sentinel-1 visually correlates the changes in the crop phenological stages to a great extent. During the initial period of Jun (24-June) the fields were not cultivated due to which the RVI value was low and hence, a dark appearance in the RVI images can be seen. On 30-July, 2019 some of the fields were cultivated with rice, but still, the majority of the fields were not sown. The sown fields exhibit slightly brighter pixels than others. Hence during this time, a mixture of different RVI values can be noticed. During 16-September all the fields were at advanced vegetative stage. This time the dense, complex canopy distribution generated high randomness in the SAR backscatter due to which all the rice cultivated fields shows brighter pixels than the previous day. Around 21-November all the fields achieved the advanced reproductive stage. Hence, the rice panicles and the complex geometry of rice crop again increases the randomness in SAR backscatter. Due to this reason, the RVI increased from 16-September to 21-November. Later during the end of December, all the rice fields were harvested, which produced lower RVI values on 27-December.
1) Temporal variation of RVI(v) depending on the rice phenological stages over Vijayawada, India using Sentinel-1 SAR data on June 24th 2019.
2) Temporal variation of RVI(v) depending on the rice phenological stages over Vijayawada, India using Sentinel-1 SAR data on July 30th 2019.
3) Temporal variation of RVI(v) depending on the rice phenological stages over Vijayawada, India using Sentinel-1 SAR data on September 16th 2019.
4) Temporal variation of RVI(v) depending on the rice phenological stages over Vijayawada, India using Sentinel-1 SAR data on November 21st 2019.
5) Temporal variation of RVI(v) depending on the rice phenological stages over Vijayawada, India using Sentinel-1 SAR data on December 27th 2019.
References
[1] Kim, Y.; van Zyl, J.J. A Time-Series Approach to Estimate Soil Moisture Using Polarimetric Radar Data. IEEE Trans. Geosci. Remote Sens. 2009, 47, 2519ñ2527.
[2] Charbonneau, F.; Trudel, M.; Fernandes, R. Use of Dual Polarization and Multi-Incidence SAR for soil permeability mapping. In Proceedings of the 2005 Advanced Synthetic Aperture Radar (ASAR) Workshop, St-Hubert, QC, Canada, 15ñ17 November 2005.
[3] Nasirzadehdizaji, Rouhollah, et al. “Sensitivity Analysis of Multi-Temporal Sentinel-1 SAR Parameters to Crop Height and Canopy Coverage.” Applied Sciences 9.4 (2019): 655.
Credits
[1] Nasirzadehdizaji, Rouhollah, et al. “Sensitivity Analysis of Multi-Temporal Sentinel-1 SAR Parameters to Crop Height and Canopy Coverage.” Applied Sciences 9.4 (2019): 655.