SAR False Color Visualization
// SAR False Color Visualization
// The script visualizes Earth surface in False Color from Sentinel-1 data.
// Author: Annamaria Luongo (Twitter: @annamaria_84, https://www.linkedin.com/in/annamaria-luongo-RS )
// License: CC BY 4.0 International

var c1 = 10e-4;
var c2 = 0.01;
var c3 = 0.02;
var c4 = 0.03;
var c5 = 0.045;
var c6 = 0.05;
var c7 = 0.9;
var c8 = 0.25;

//Enhanced or non-enhanced option (set to "true" if you want enhanced)
var enhanced = false;

if (enhanced != true) {
    //Non-enhanced option
    var band1 = c4 + Math.log(c1 - Math.log(c6 / (c3 + 2 * VV)));
    var band2 = c6 + Math.exp(c8 * (Math.log(c2 + 2 * VV) + Math.log(c3 + 5 * VH)));
    var band3 = 1 - Math.log(c6 / (c5 - c7 * VV));
}
else {
    //Enhanced option
    var band1 = c4 + Math.log(c1 - Math.log(c6 / (c3 + 2.5 * VV)) + Math.log(c6 / (c3 + 1.5 * VH)));
    var band2 = c6 + Math.exp(c8 * (Math.log(c2 + 2 * VV) + Math.log(c3 + 7 * VH)));
    var band3 = 0.8 - Math.log(c6 / (c5 - c7 * VV));
}

return [band1, band2, band3];Evaluate and Visualize
Description
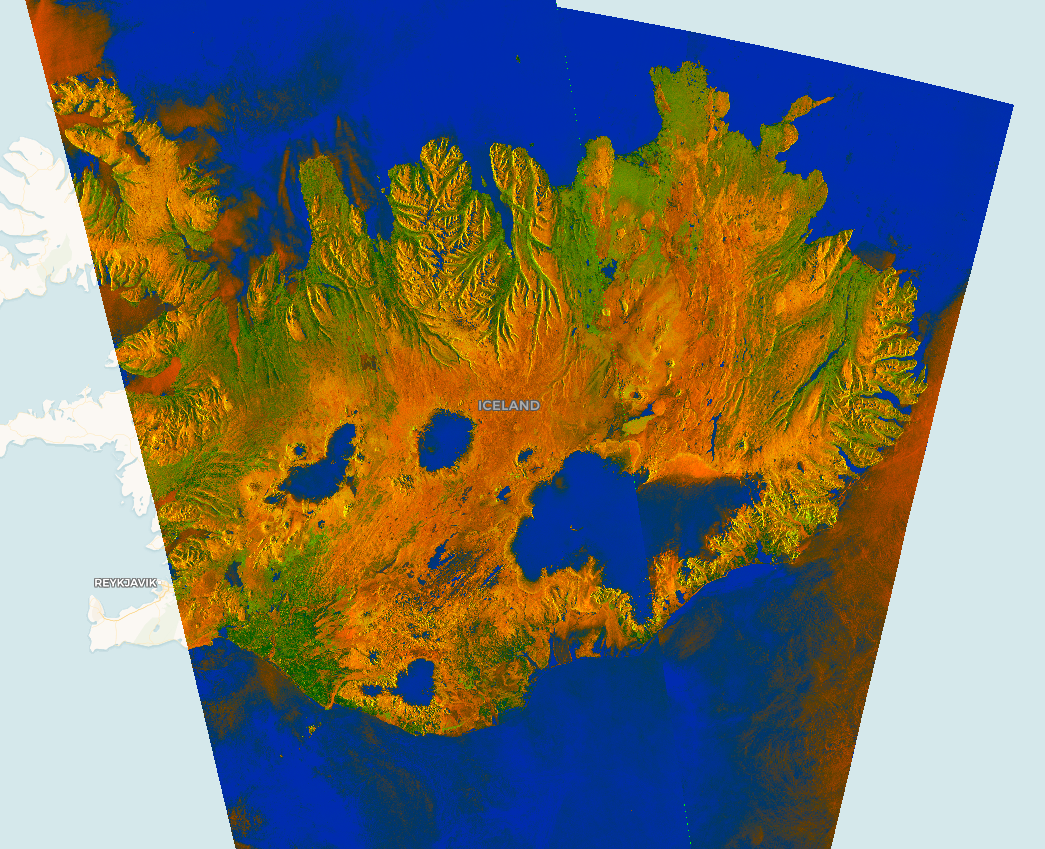
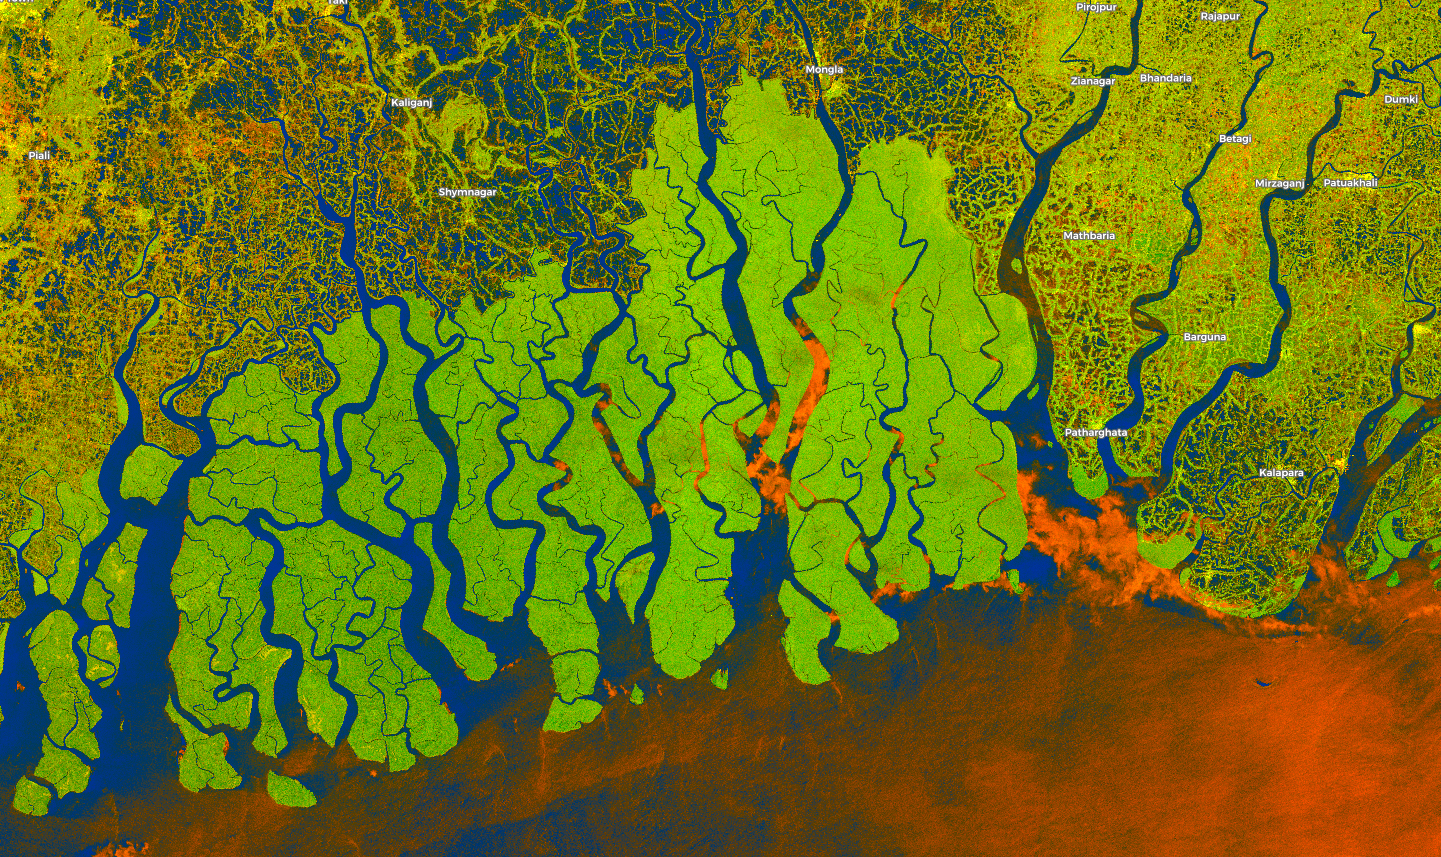
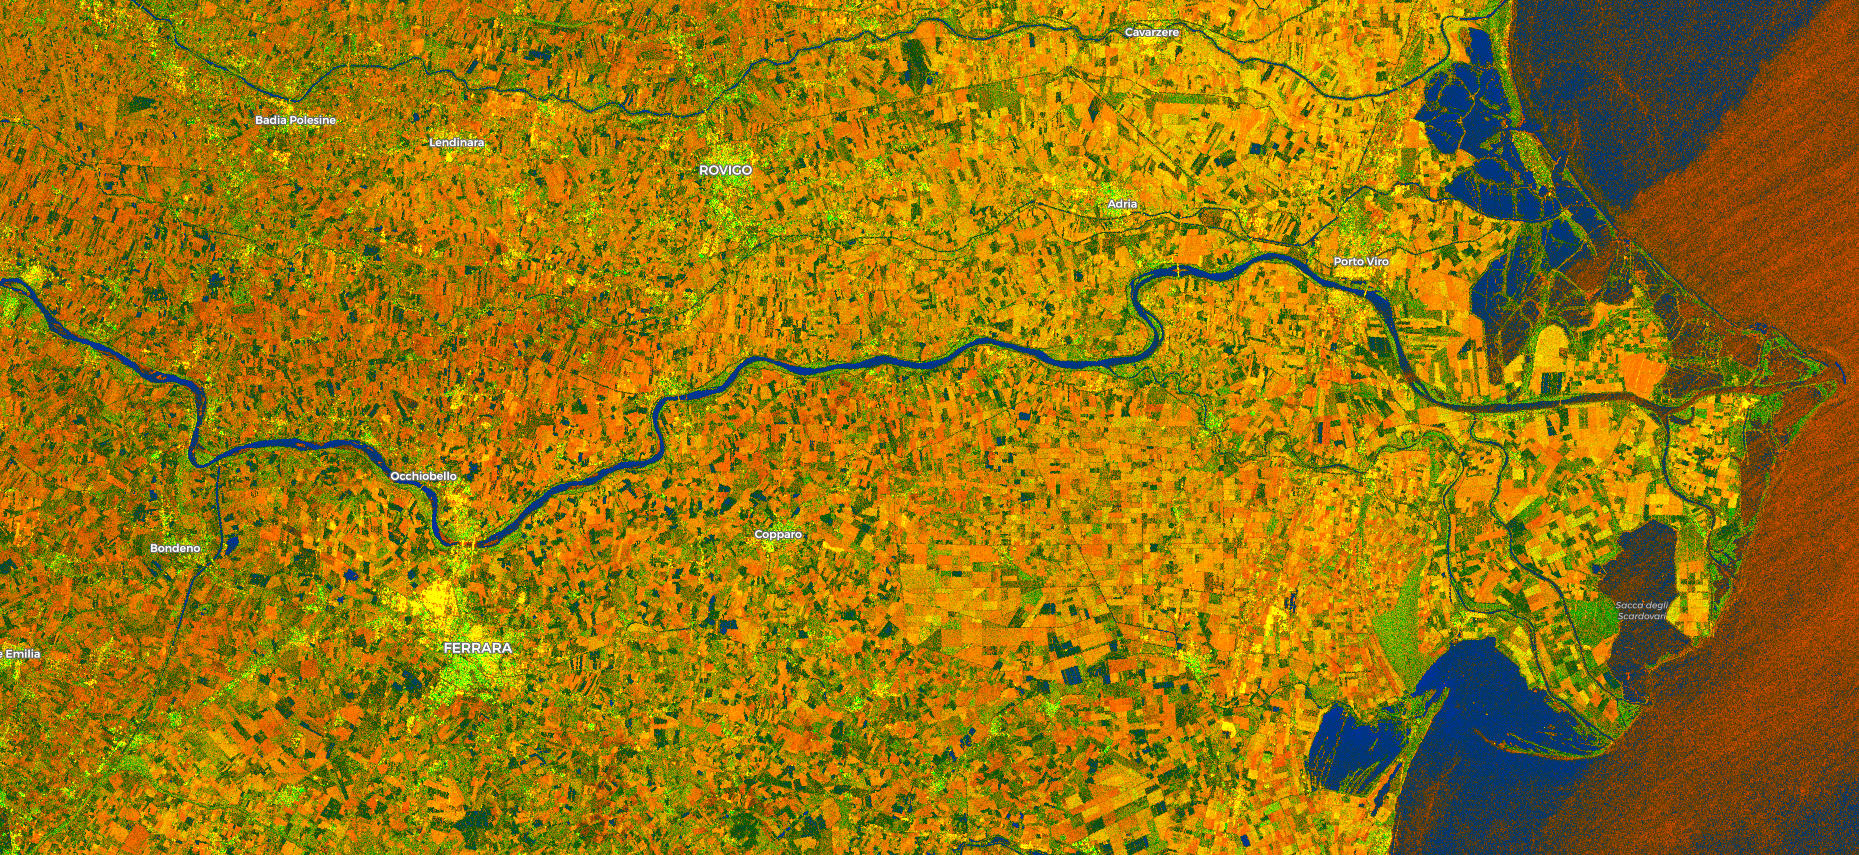
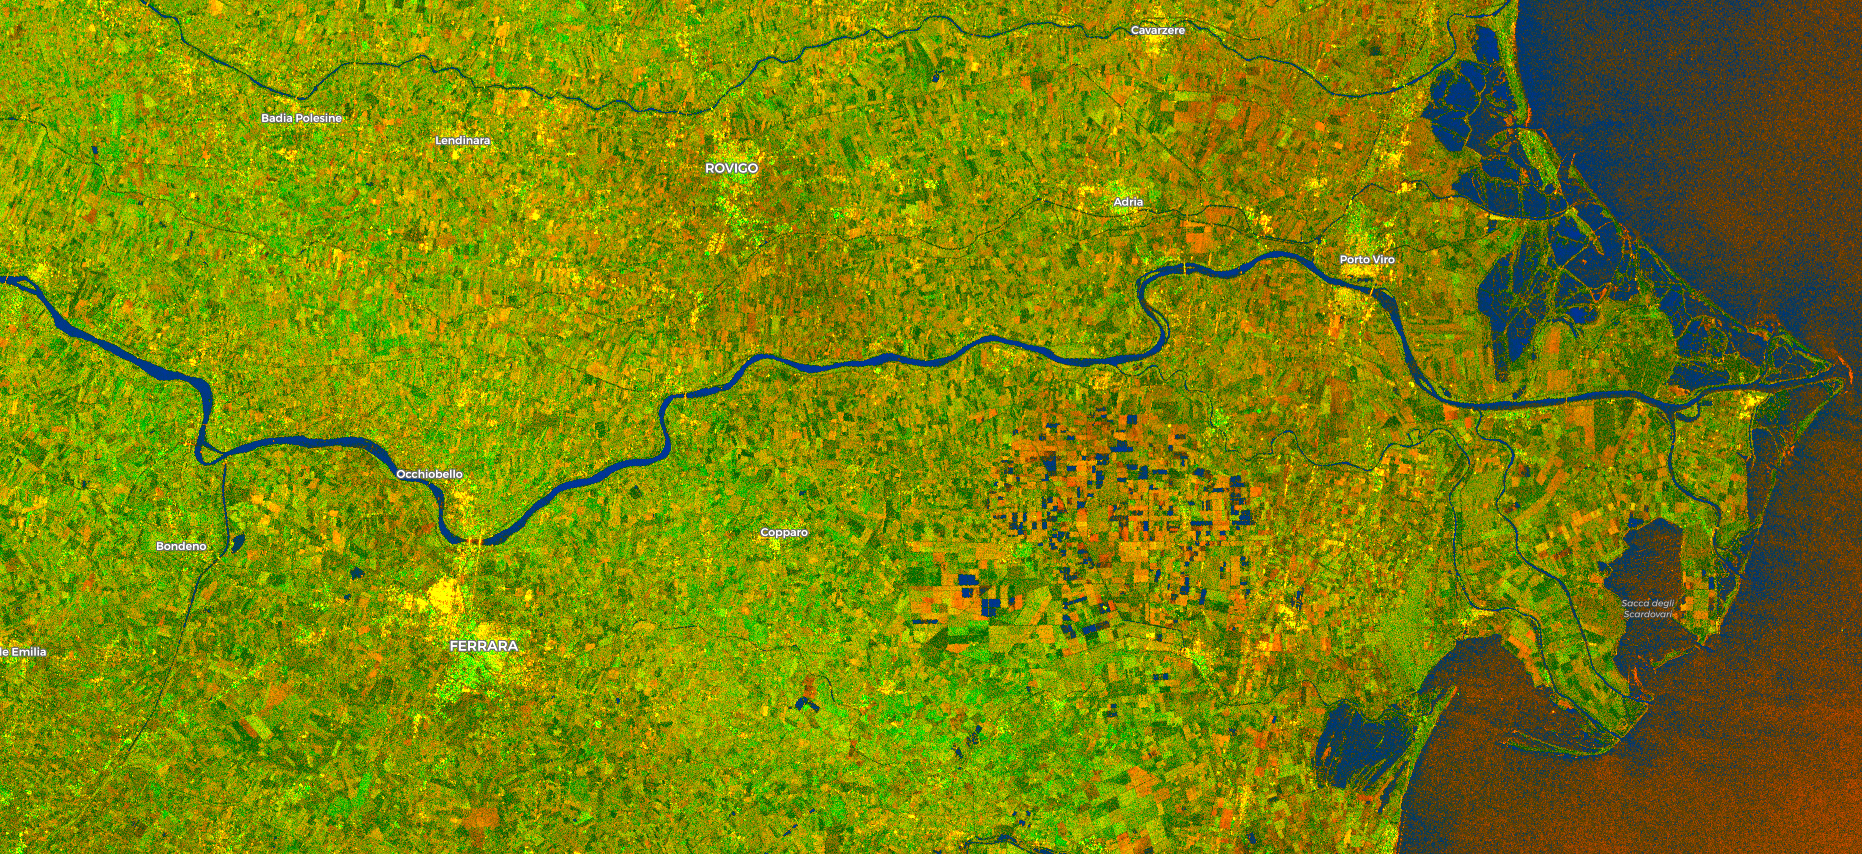
The script visualizes Earth surface in False Color from Sentinel-1 data.
It helps in maritime monitoring (ice monitoring, ship monitoring,…) land monitoring (agricolture, deforestation,…) and emergency management (flood monitoring, volcano monitoring, …).
Contributors:
Examples non-ehanced:
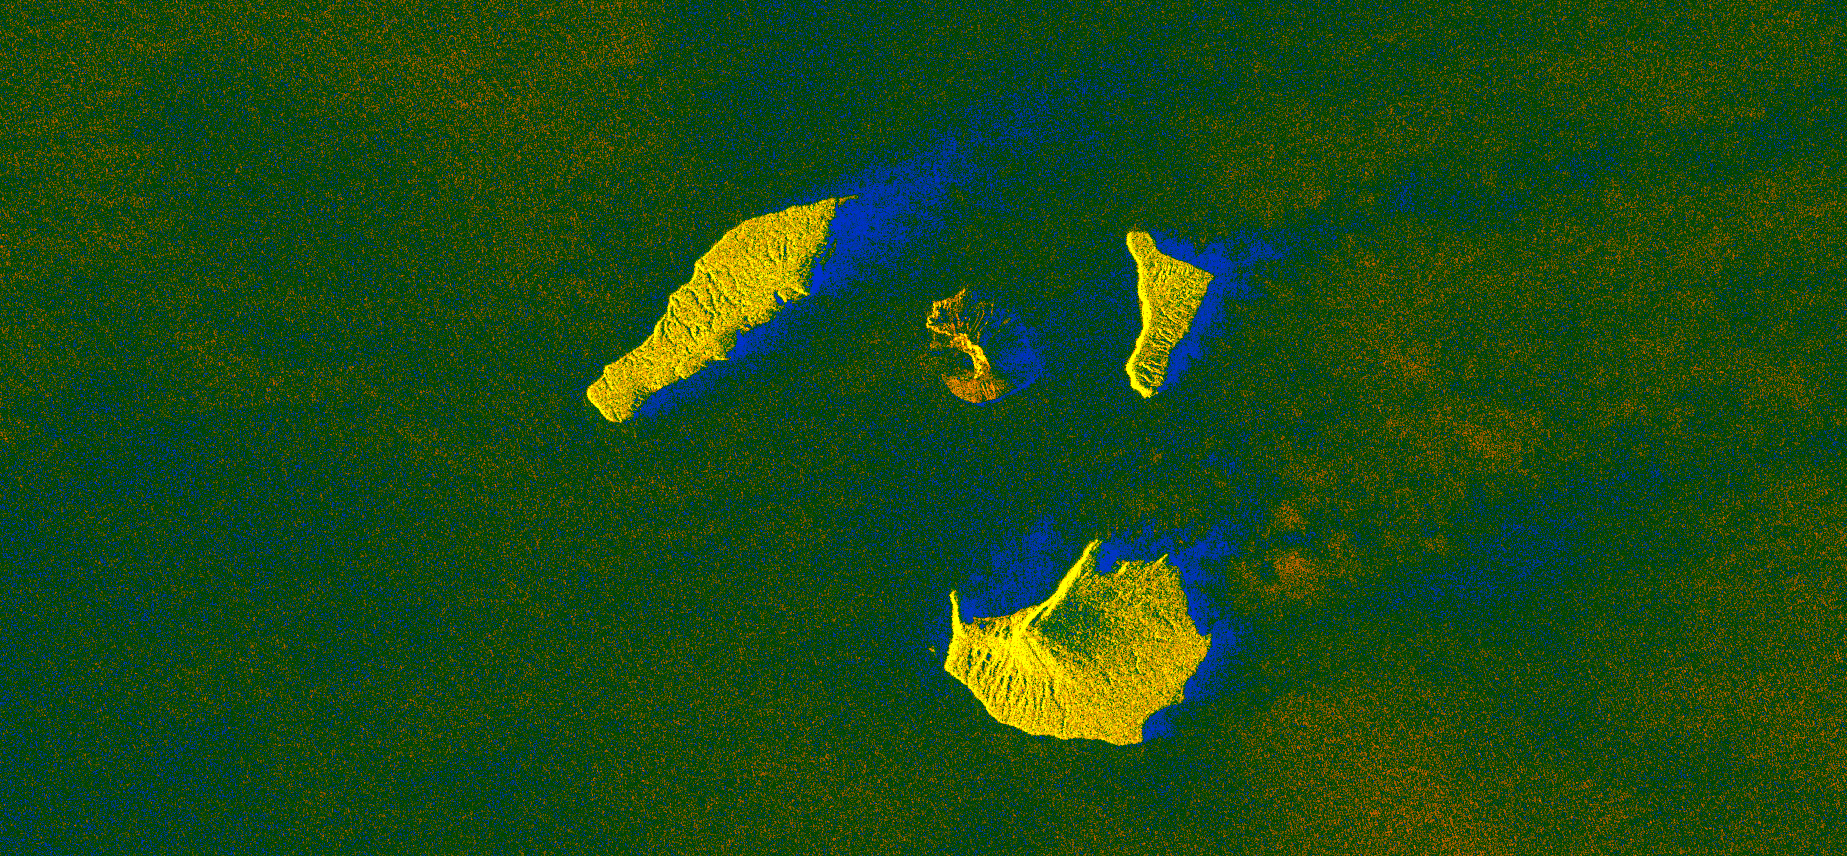
Veira glacier
Anak Krakatau
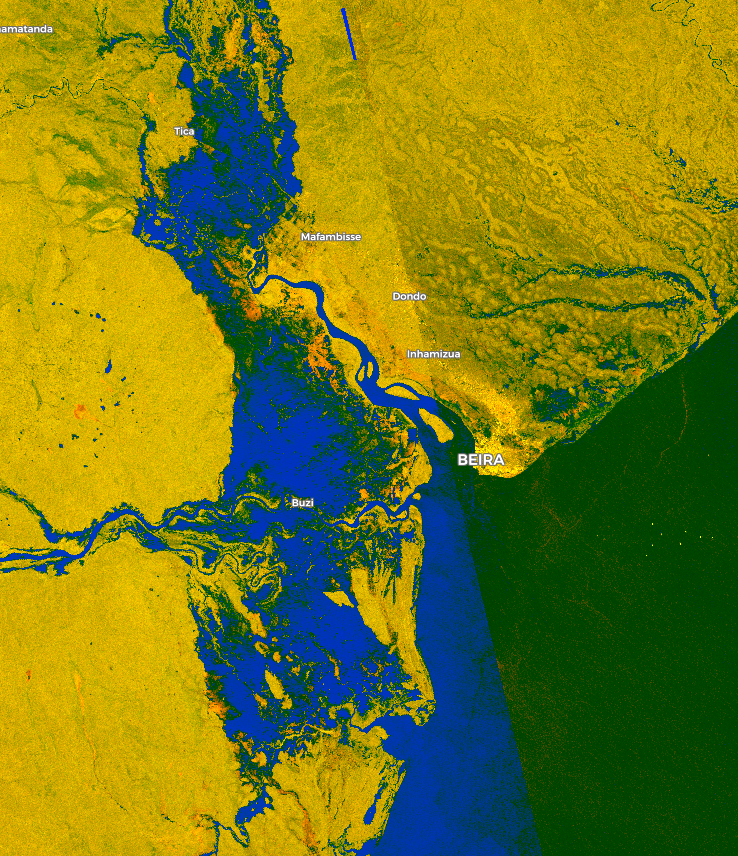
Mozambique Flood
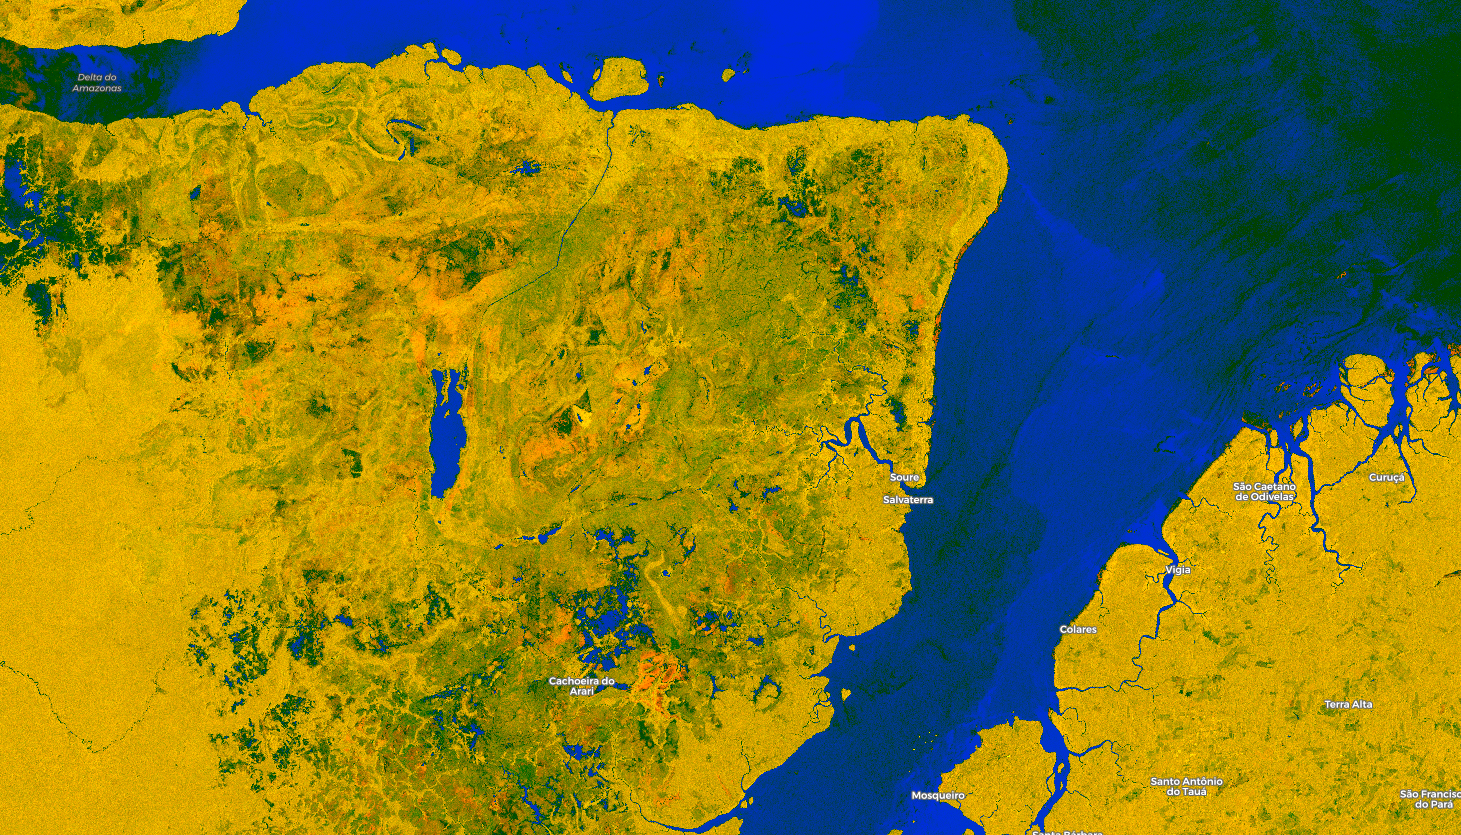
Mangrove Forest - Brazil’s Marajo island
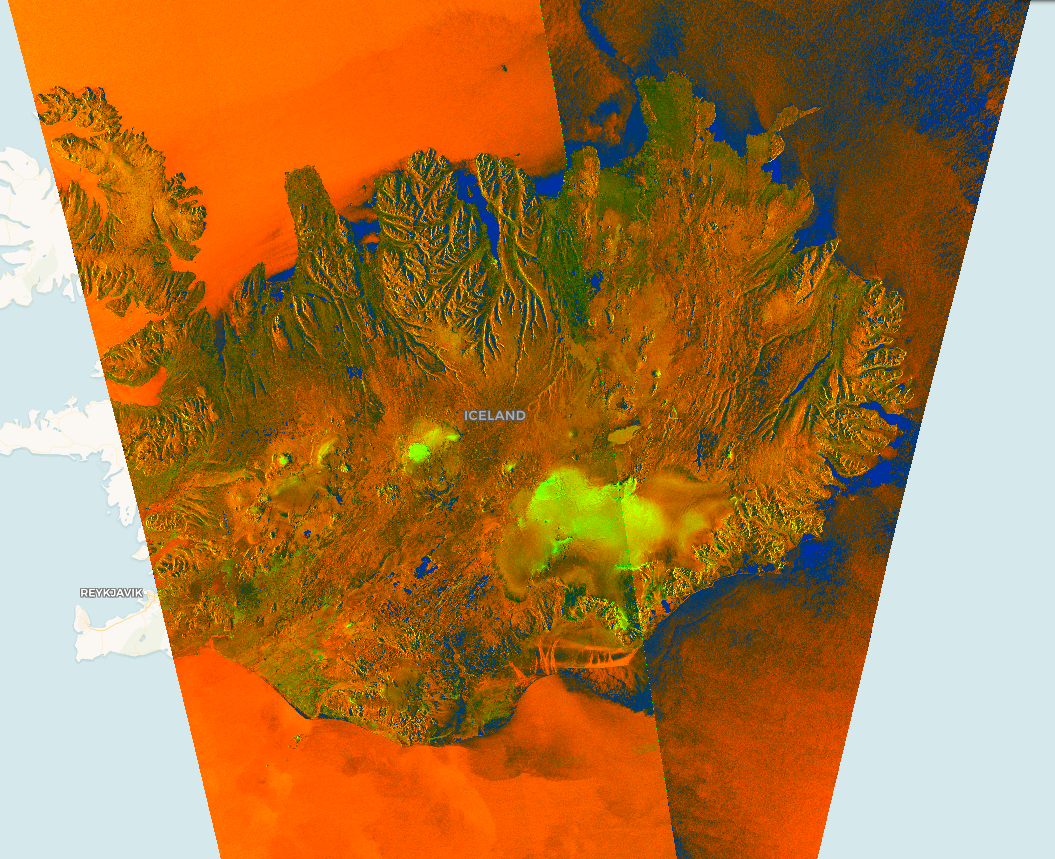
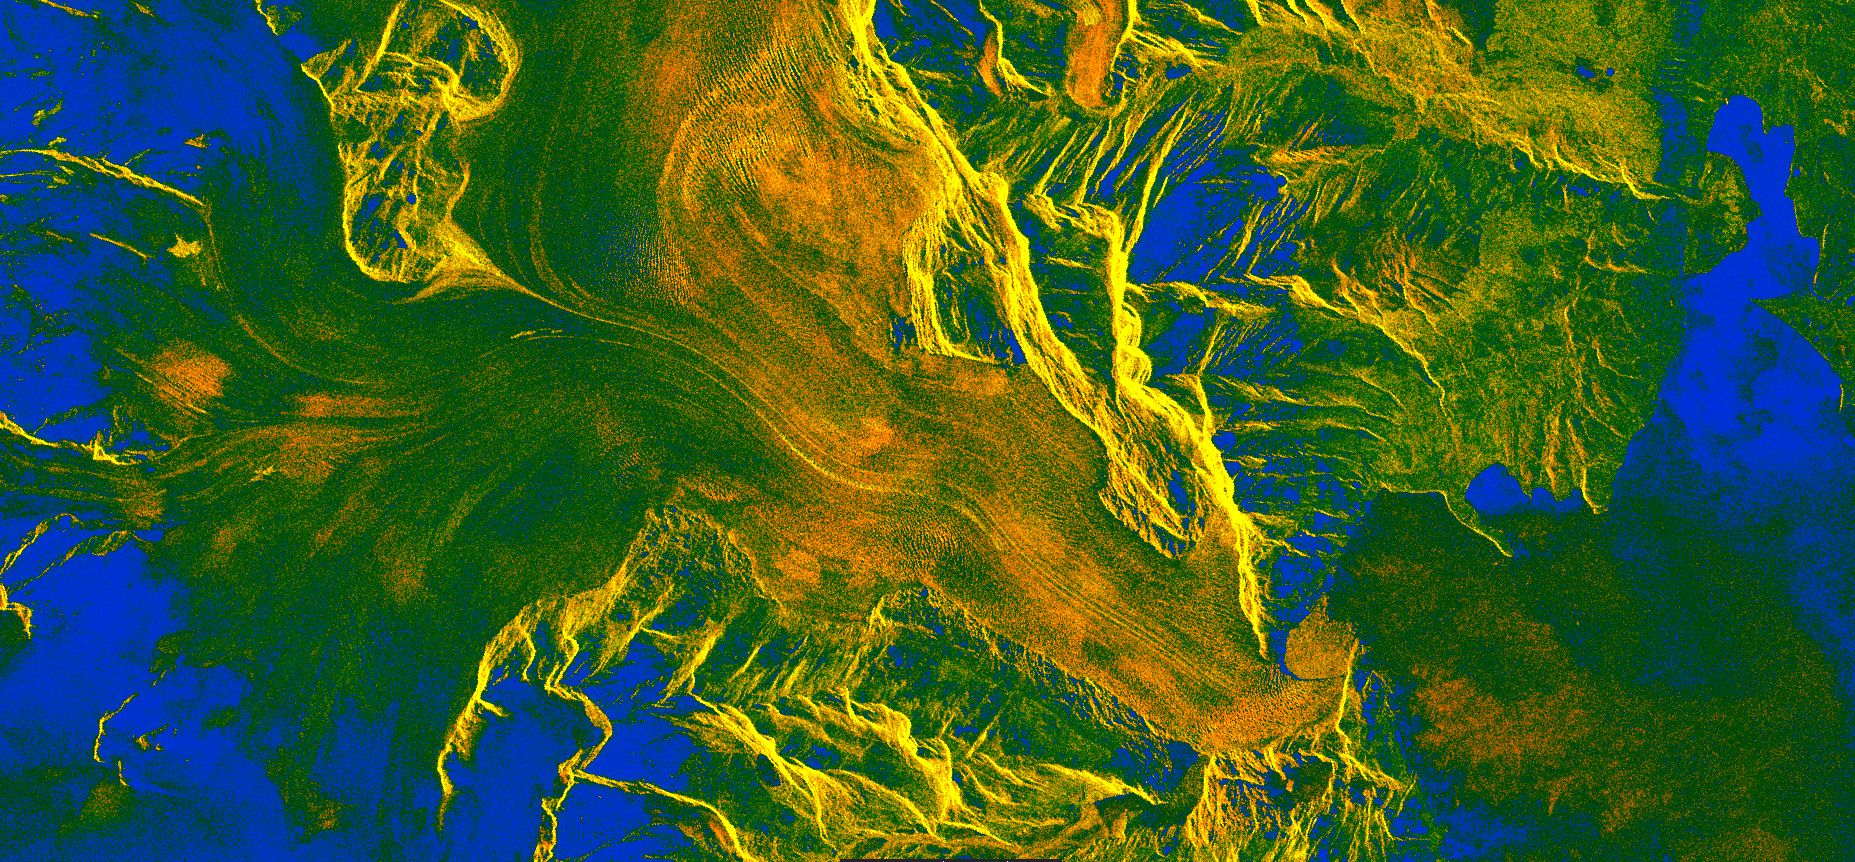
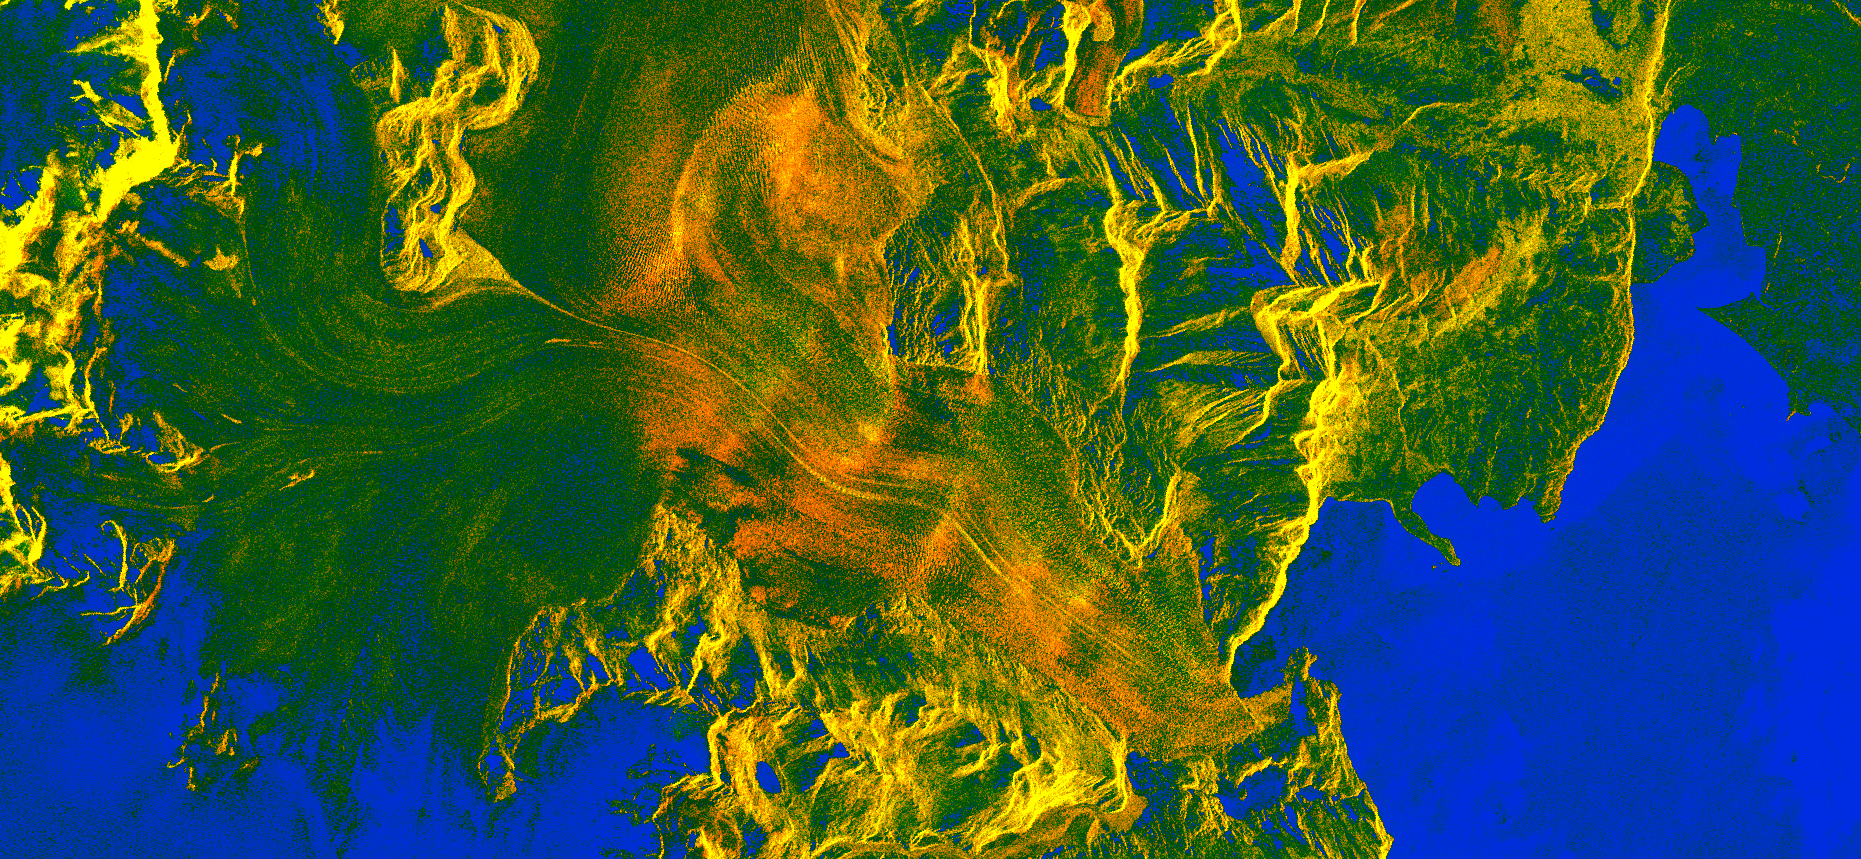
Examples enhanced:
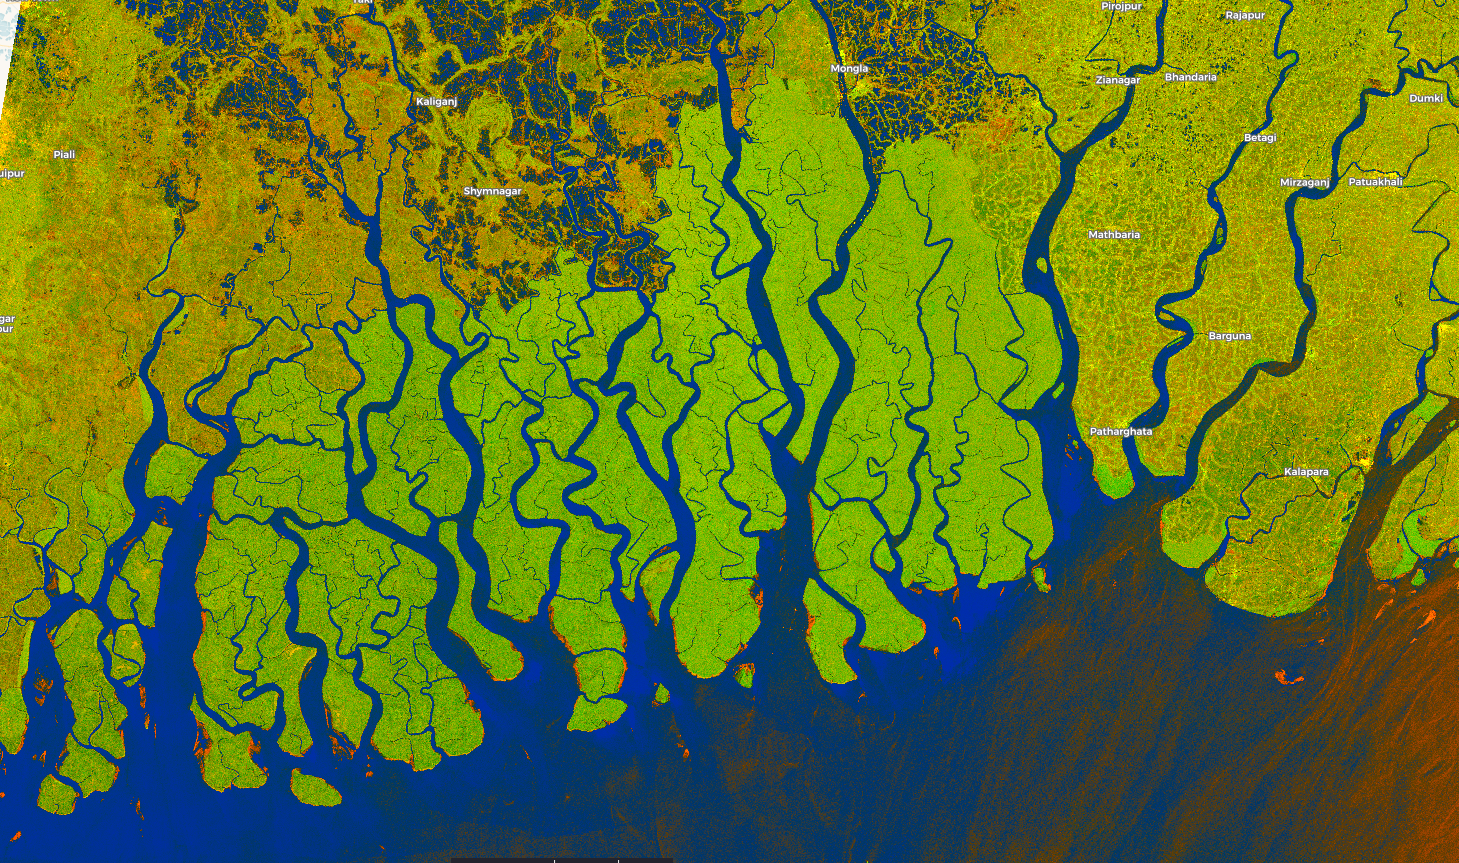
Gange delta
Po delta and Padana Plain
Iceland