Sentinel-1 Multi-temporal Backscatter Coefficient Composite
//VERSION=3 (auto-converted from 1)
// ***
// Sentinel-1 Multi-temporal Backscatter Coefficient Composite
// For use in Sinergise EO Browser (https://apps.sentinel-hub.com/eo-browser).
// Multi-temporal processing needs to be configured for layers.
// Author: Annamaria Luongo (Twitter: @annamaria_84, www.linkedin.com/in/annamaria-luongo-RS),
// CC BY 4.0 International - https://creativecommons.org/licenses/by/4.0/
// ***
// ****General definition*************
//Definition date/images used in the composite
var earliest_date = "2018-04-11"; var middle_date = "2018-06-10"; var latest_date = "2018-08-21"; // Kilauea volcano evolution during 2018's eruption
//var earliest_date = "2019-03-13"; var middle_date = "2019-03-19"; var latest_date = "2019-03-25"; // Beira flooding, Mozambique
//var earliest_date = "2018-05-06"; var middle_date = "2018-06-05"; var latest_date = "2018-07-11"; // Po delta, Italy, soil/crop evolution
//var earliest_date = "2017-05-13"; var middle_date = "2017-07-06"; var latest_date = "2017-07-12"; // Vesuvio wildfire, Italy
//var earliest_date = "2018-12-19"; var middle_date = "2018-12-25"; var latest_date = "2018-12-31"; // Anak Krakatau Volcano evolution during the first three weeks after the eruption
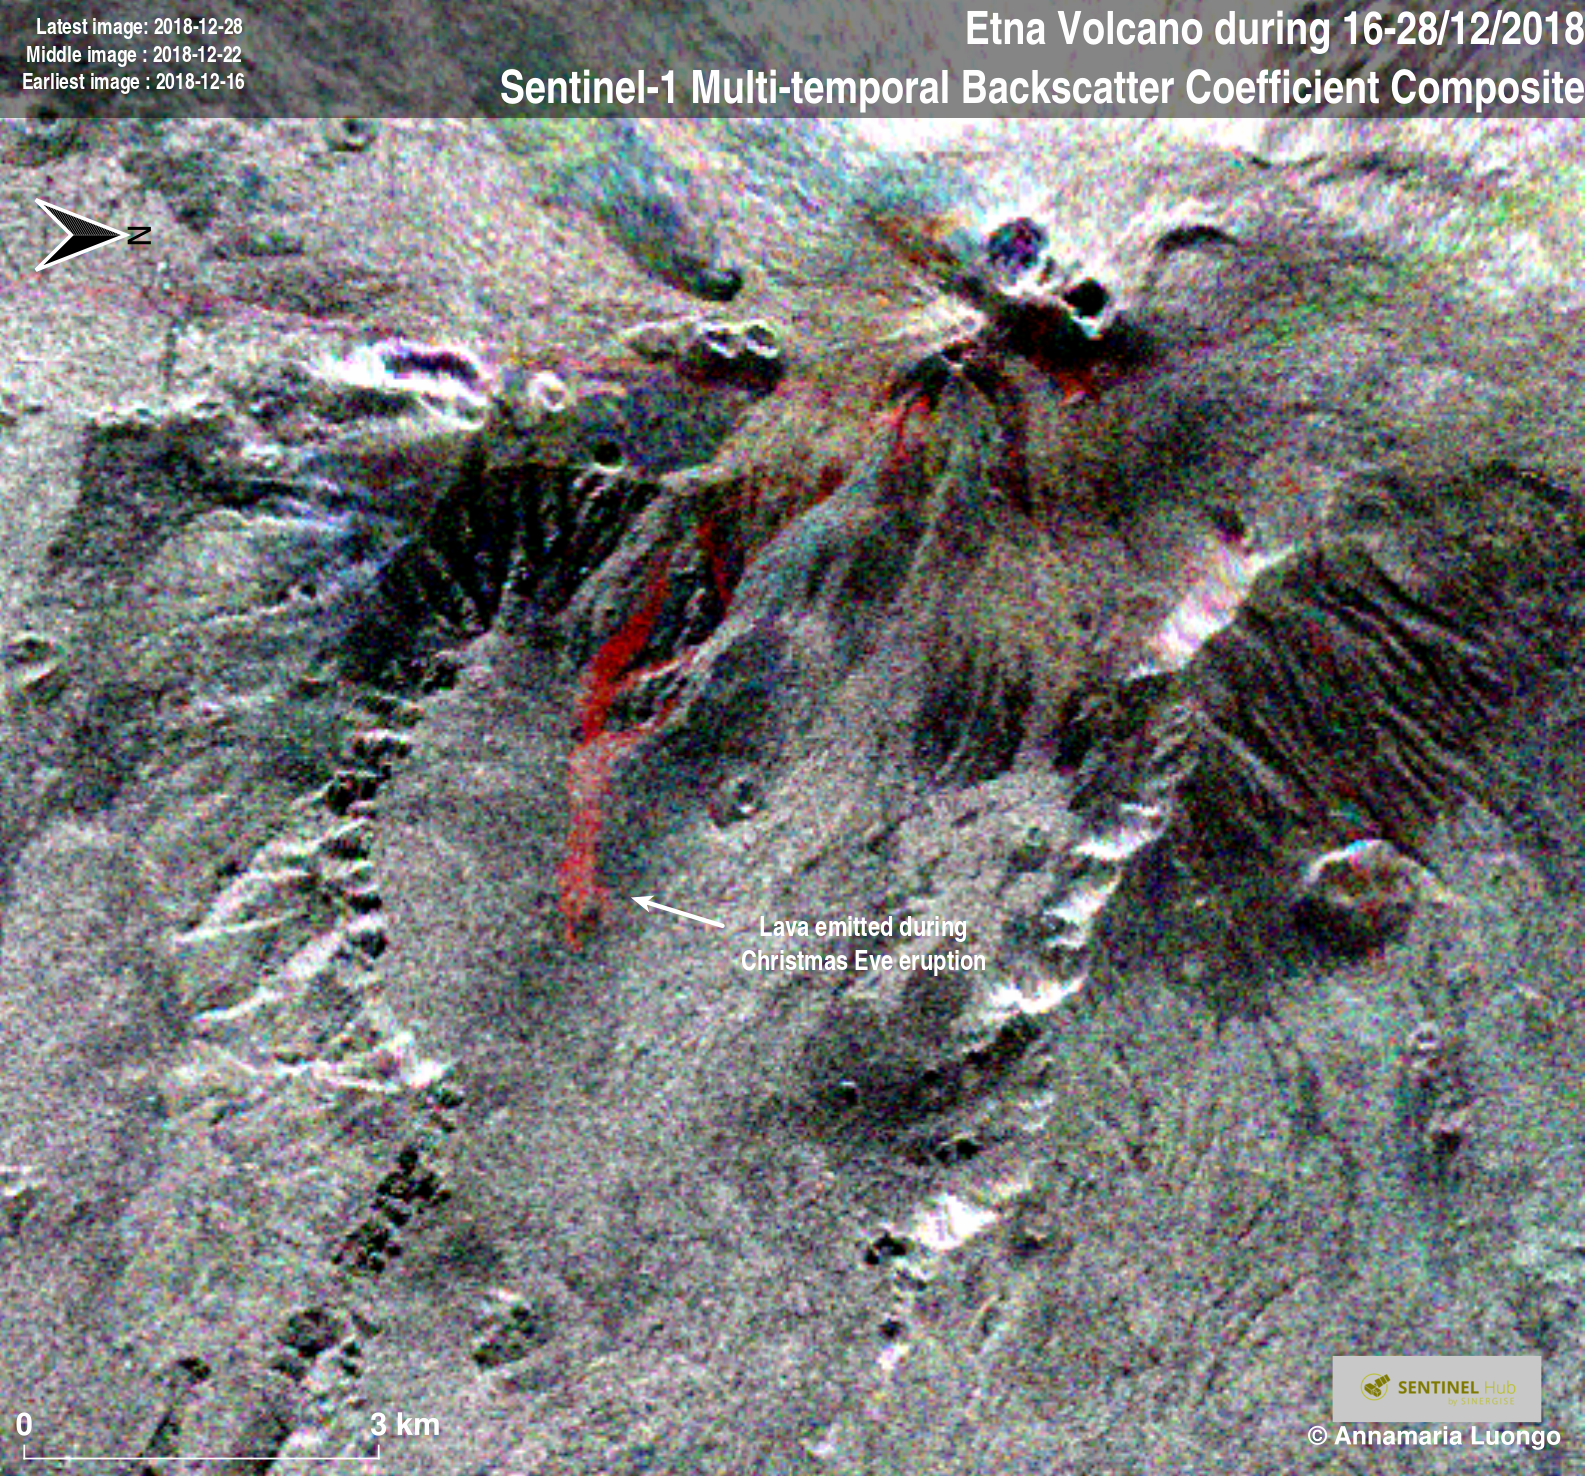
//var earliest_date = "2018-12-16"; var middle_date = "2018-12-22"; var latest_date = "2018-12-28"; // Etna Volcano, Christmas' eve eruption
//var earliest_date = "2017-04-13"; var middle_date = "2018-04-20"; var latest_date = "2019-04-15"; // Viedma glacier, Argentina, during 2017-2019
//var earliest_date = "2017-04-13"; var middle_date = "2018-04-20"; var latest_date = "2019-04-15"; // Filadelfia, Paraguay, deforestation
//var earliest_date = "2018-03-25"; var middle_date = "2018-08-16"; var latest_date = "2018-12-26"; // Mekong delta, Vietnam, rice growth
//var earliest_date = "2017-04-16"; var middle_date = "2018-04-11"; var latest_date = "2019-04-06"; // Mississipi delta, USA, during 2017-2019
// Definition stretch value for Composite
var stretch_min = 0.0; var stretch_max = 1.1; // default value are stretch_min = 0; stretch_max = 1.1.
// ***********************************
// Selection of polarization
function setup() {
return {
input: [{
bands: [
"VV"
]
}],
output: { bands: 3 },
mosaicking: "ORBIT"
}
}
// Selection of dates for composite / analysis
function preProcessScenes(collections) {
var allowedDates = [latest_date, middle_date, earliest_date]; //(1°date/latest image-> red; 2°date-> green; 3°date/earliest image->blue)
collections.scenes.orbits = collections.scenes.orbits.filter(function (orbit) {
var orbitDateFrom = orbit.dateFrom.split("T")[0];
return allowedDates.includes(orbitDateFrom);
})
return collections
}
// Date conversion
function dateformat(d) {
var dd = d.getDate();
var mm = d.getMonth() + 1;
var yyyy = d.getFullYear();
if (dd < 10) { dd = '0' + dd }
if (mm < 10) { mm = '0' + mm }
var isodate = yyyy + '-' + mm + '-' + dd;
return isodate;
}
// Backscatter Coefficient
function calcdB(sample) {
return (Math.max(0, Math.log((sample.VV)) * 0.21714724095 + 1));
}
// Stretch of RGB
function stretch(val, min, max) {
return (val - min) / (max - min);
}
// RGB visualization
function evaluatePixel(samples) {
var band1 = calcdB(samples[2]); // R: latest image
var band2 = calcdB(samples[1]); // G: middle-time image
var band3 = calcdB(samples[0]); // B: earliest image
var FalseColors = [stretch(band1, stretch_min, stretch_max), stretch(band2, stretch_min, stretch_max), stretch(band3, stretch_min, stretch_max)];
return (FalseColors);
}Description
For the interpretation of results, you can use The Synthetic Aperture Radar (SAR) Handbook: Comprehensive Methodologies for Forest Monitoring and Biomass Estimation, 2019: table 3.1 page 66.
The book is available for free here.
The script visualizes Earth surface in False Color from Sentinel-1 data.
It helps in maritime monitoring (ice monitoring, ship monitoring,…) land monitoring (agricolture, deforestation,…) and emergency management (flood monitoring, volcano monitoring, …).
Examples