Water Surface Roughness Visualization
// Water Surface Roughness Visualization
// Author: Annamaria Luongo (Twitter: @annamaria_84, https://www.linkedin.com/in/annamaria-luongo-RS)
// License: CC BY 4.0 International - https://creativecommons.org/licenses/by/4.0/

var val = Math.log(0.05 / (0.018 + VV * 1.5));
return [val]; Evaluate and Visualize
Description
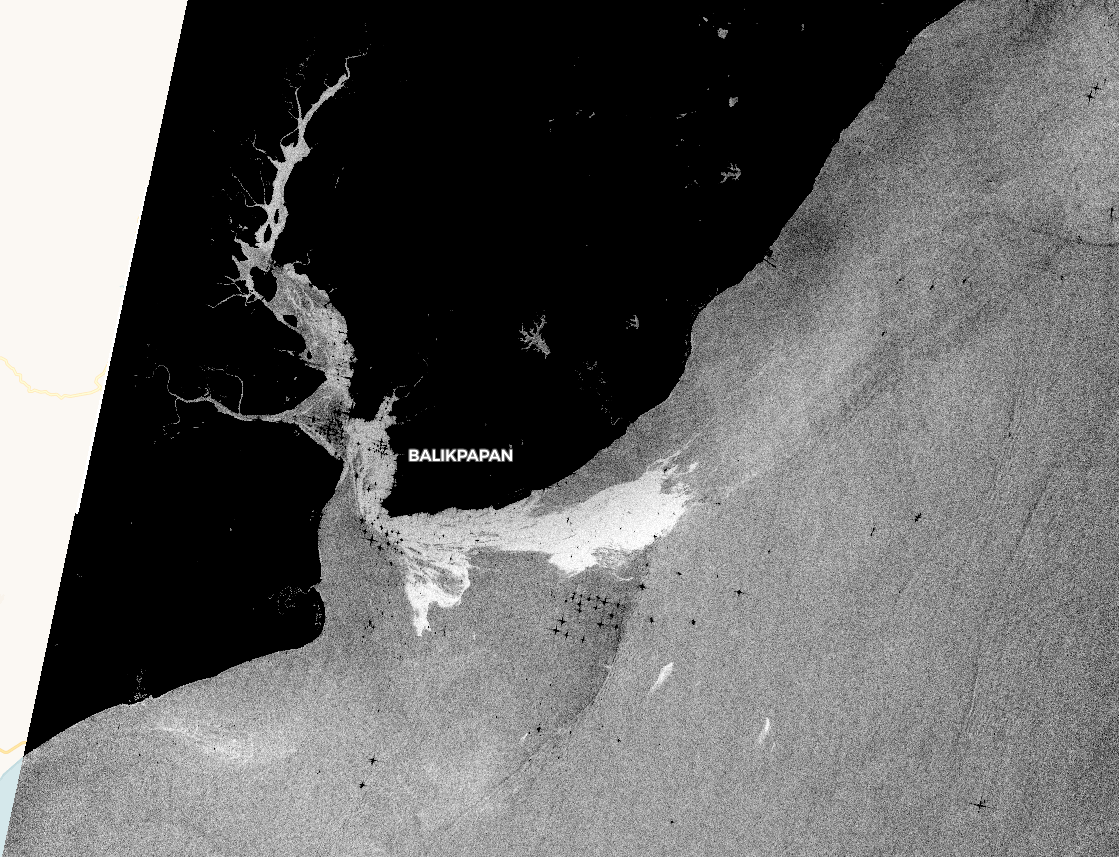
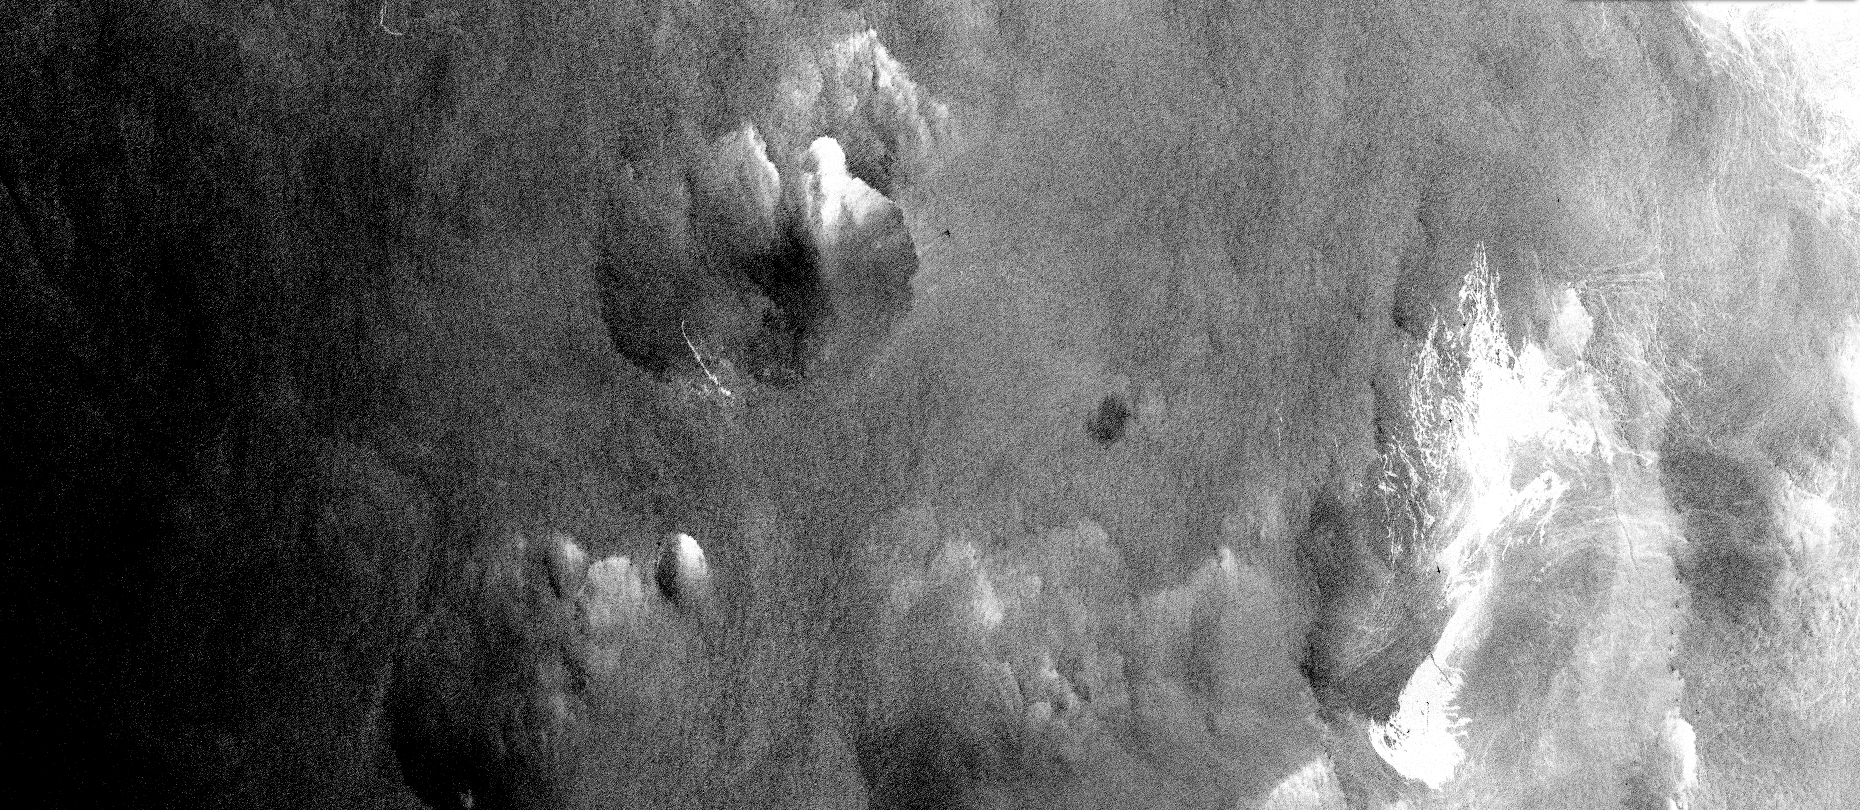
The script visualizes the Water Surface Roughness from Sentinel-1 data. It helps in maritime monitoring (ship monitoring, oil pollution monitoring, sea currents, …).
Contributors:
Examples:
Oil Spill Balikpapan Indonesia, 1/4/2018
Oil Spill Grande America, 19/3/2019
Adriatic Sea Currents
