Cyanobacteria Chlorophyll-a NDCI L1C
// CyanoLakes Chlorophyll-a L1C
// Jeremy Kravitz & Mark Matthews (2020)

// Water body detection - credit Mohor Gartner
var MNDWI_threshold=0.42; //testing shows recommended 0.42 for Sentinel-2 and Landsat 8. For the scene in article [1] it was 0.8.
var NDWI_threshold=0.4; //testing shows recommended 0.4 for Sentinel-2 and Landsat 8. For the scene in article [1] it was 0.5.
var filter_UABS=true;
var filter_SSI=false;
function wbi(r,g,b,nir,swir1,swir2) {
    //water surface
    let ws=0;
    //try as it might fail for some pixel
    try {
        //calc indices
        //[4][5][1][8][2][3]
        var ndvi=(nir-r)/(nir+r),mndwi=(g-swir1)/(g+swir1),ndwi=(g-nir)/(g+nir),ndwi_leaves=(nir-swir1)/(nir+swir1),aweish=b+2.5*g-1.5*(nir+swir1)-0.25*swir2,aweinsh=4*(g-swir1)-(0.25*nir+2.75*swir1);
        //[10][11][12]
        var dbsi=((swir1-g)/(swir1+g))-ndvi,wii=Math.pow(nir,2)/r,wri=(g+r)/(nir+swir1),puwi=5.83*g-6.57*r-30.32*nir+2.25,uwi=(g-1.1*r-5.2*nir+0.4)/Math.abs(g-1.1*r-5.2*nir),usi=0.25*(g/r)-0.57*(nir/g)-0.83*(b/g)+1;
        //DEFINE WB
        if (mndwi>MNDWI_threshold||ndwi>NDWI_threshold||aweinsh>0.1879||aweish>0.1112||ndvi<-0.2||ndwi_leaves>1) {ws=1;}
        //filter urban areas [3] and bare soil [10]
        if (filter_UABS && ws==1) {
            if ((aweinsh<=-0.03)||(dbsi>0)) {ws=0;}
        }
    }catch(err){ws=0;}
    return ws;
}
let water = wbi(B04,B03,B02,B08,B11,B12);

// Floating vegetation
function FAI (a,b,c) {return (b-a-(c-a)*(783-665)/(865-665))};
let FAIv = FAI(B04,B07,B8A);

// Chlorophyll-a
function NDCI (a,b) {return (b-a)/(b+a)};
let NDCIv = NDCI(B04,B05);
let chl = 826.57 * NDCIv**3 - 176.43 * NDCIv**2 + 19 * NDCIv + 4.071; // From simulated data

// Ture colour
let trueColor = [3*B04,3*B03,3*B02];

// Render colour map
if (water==0) {
    return trueColor;
} else if (FAIv>0.08){
    return [233/255,72/255,21/255];
} else if (chl<0.5){
    return [0,0,1.0];
} else if (chl<1){
    return [0,0,1.0];
} else if (chl<2.5){
    return [0,59/255,1];
} else if (chl<3.5){
    return [0,98/255,1];
} else if (chl<5){
    return [15/255,113/255,141/255];
} else if (chl<7){
    return [14/255,141/255,120/255];
} else if (chl<8){
    return [13/255,141/255,103/255];
} else if (chl<10){
    return [30/255,226/255,28/255];
} else if (chl<14){
    return [42/255,226/255,28/255];
} else if (chl<18){
    return [68/255,226/255,28/255];
} else if (chl<20){
    return [68/255,226/255,28/255];
} else if (chl<24){
    return [134/255,247/255,0];
} else if (chl<28){
    return [140/255,247/255,0];
} else if (chl<30){
    return [205/255,237/255,0];
} else if (chl<38){
    return [208/255,240/255,0];
} else if (chl<45){
    return [208/255,240/255,0];
} else if (chl<50){
    return [251/255,210/255,3/255];
} else if (chl<75){
    return [248/255,207/255,2/255];
} else if (chl<90){
    return [134/255,247/255,0];
} else if (chl<100){
    return [245/255,164/255,9/255];
} else if (chl<150){
    return [240/255,159/255,8/255];
} else if (chl<250){
    return [237/255,157/255,7/255];
} else if (chl<300){
    return [239/255,118/255,15/255];
} else if (chl<350){
    return [239/255,101/255,15/255];
} else if (chl<450){
    return [239/255,100/255,14/255];
} else if (chl<500){
    return [233/255,72/255,21/255];
} else return [233/255,72/255,21/255];Evaluate and Visualize
General description of the script
Provides an estimate of chlorophyll-a for cyanobacteria blooms for surface waterbodies using the Normalised Difference Chlorophyll Index for use with L1C Sentinel-2 data.
The chlorophyll-a estimation is based on simulated dataset for cyanobacteria Microcystis Aeruginosa using methods that can be found in Kravitz et al., (2021).
Also uses the Floating Algal Index (Hu, 2009) to detect surface blooms and floating vegetation.
Uses the water bodies mapping technique of Mohor Gartner.
Visualises land using a simple RGB approach.
Technical details
A chl-a retrieval model was calibrated using a novel, high quality synthetic dataset of coincident S2-MSI remote sensing reflectance (Rrs) and pigment concentrations (figure below). The parameterization of the dataset was informed by the LIMNADES dataset Lake Bio-optical Measurements and Matchup Data for Remote Sensing and compiled using the Hydrolight radiative transfer software (version 5.2, Sequoia Scientific, USA; Mobley, 1994). The unique dataset accounts for the optical complexity of mixed cyanobacteria phytoplankton assemblages, and immense optical variability typically found in global inland water bodies.
In order to produce a fast and robust chl-a estimate from S2, the normalized difference chlorophyll index (NDCI) was used to establish an empirically derived chl-a model (Mishra and Mishra, 2012). The NDCI model utilizes MSI spectral bands located at 665 nm and 705 nm, which are maximally sensitive to chl-a absorption, and backscattering induced reflectance, respectively. NDCI is calculated by taking the spectral difference of these two bands, and normalizing by their sums, as follows:
NDCI = [Rrs(705) – Rrs(665)] / [Rrs(705) + Rrs(665)] (1)
The index was trained on synthetic data with the following restrictions to limit uncertainty due to extreme cases:
- Concentration of non-algal particles (Cnap) < 10 ug/L
- Absorption due to coloured dissolved organic matter (CDOM) < 3 m-1
- Chl-a concentrations less than 500 ug/L
- Only cyanobacteria M. aeruginosa used in training.
This resulting in 9836 samples, which were separated into a training dataset of 7868 samples (80%) and a dataset to test the predictive capability of the model of 1968 samples (20%). An exponential model resulted in the best fit on the training data (eq. 2) based on Pearson correlation coefficient (R2=0.52), with predictive statistics shown in the figure below.
Chl-a = 17.441e(4.7038*NDCI) (2)
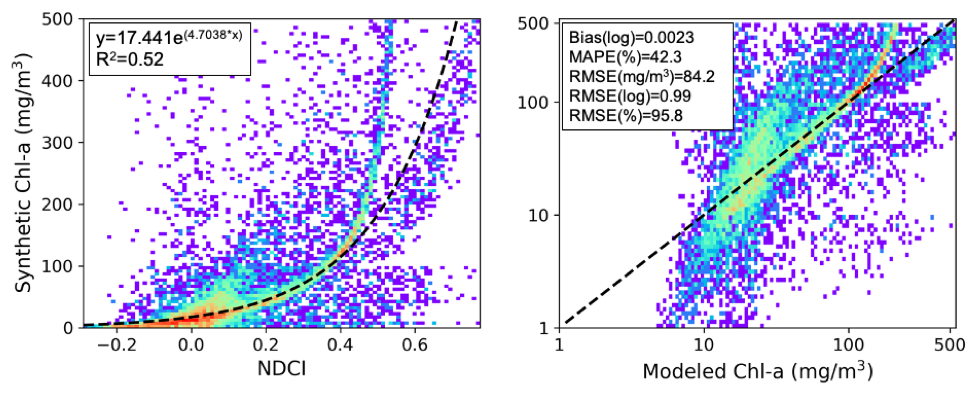
Table 1: Predictive capability of calibrated NDCI model
| Log Bias | MAPE (%) | RMSE (mg/m3) | Log RMSE | Relative RMSE (%) |
|---|---|---|---|---|
| 0.0023 | 42.3 | 84.2 | 0.99 | 95.8 |
Representative Images
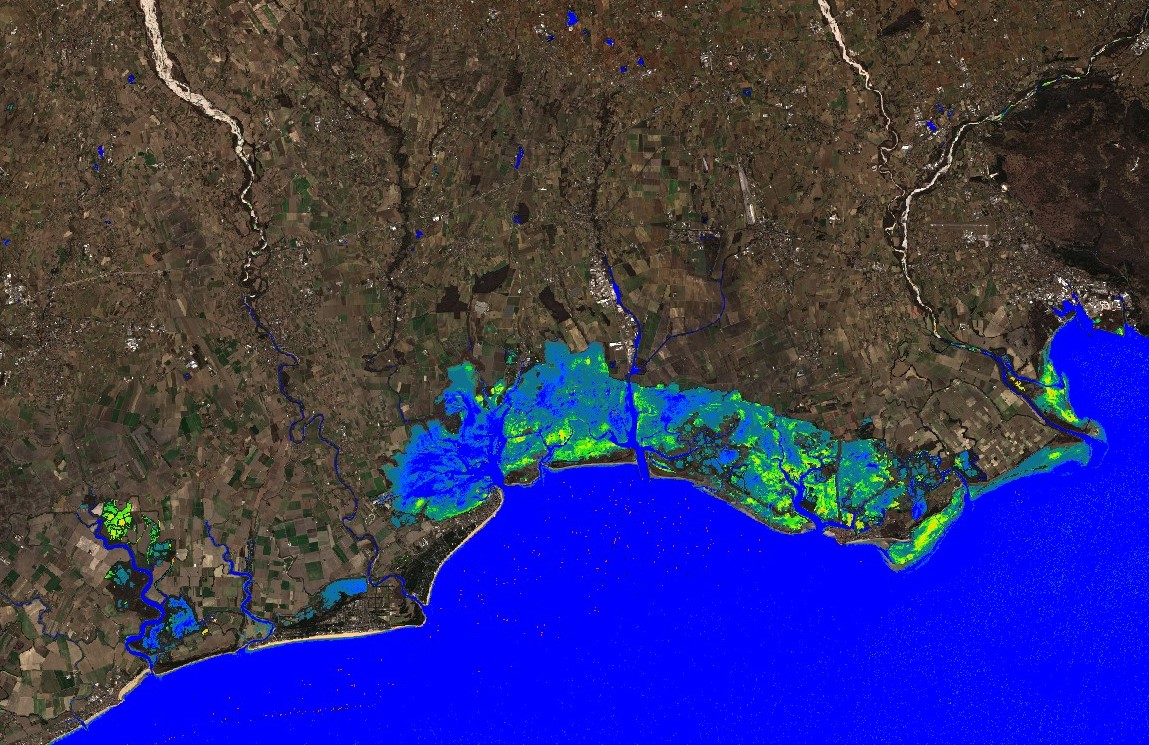
Cyanobacteria Chlorophyll-a NDCI L1C applied to lagoons of Northeastern Italy. Image acquired on 2022-02-12.
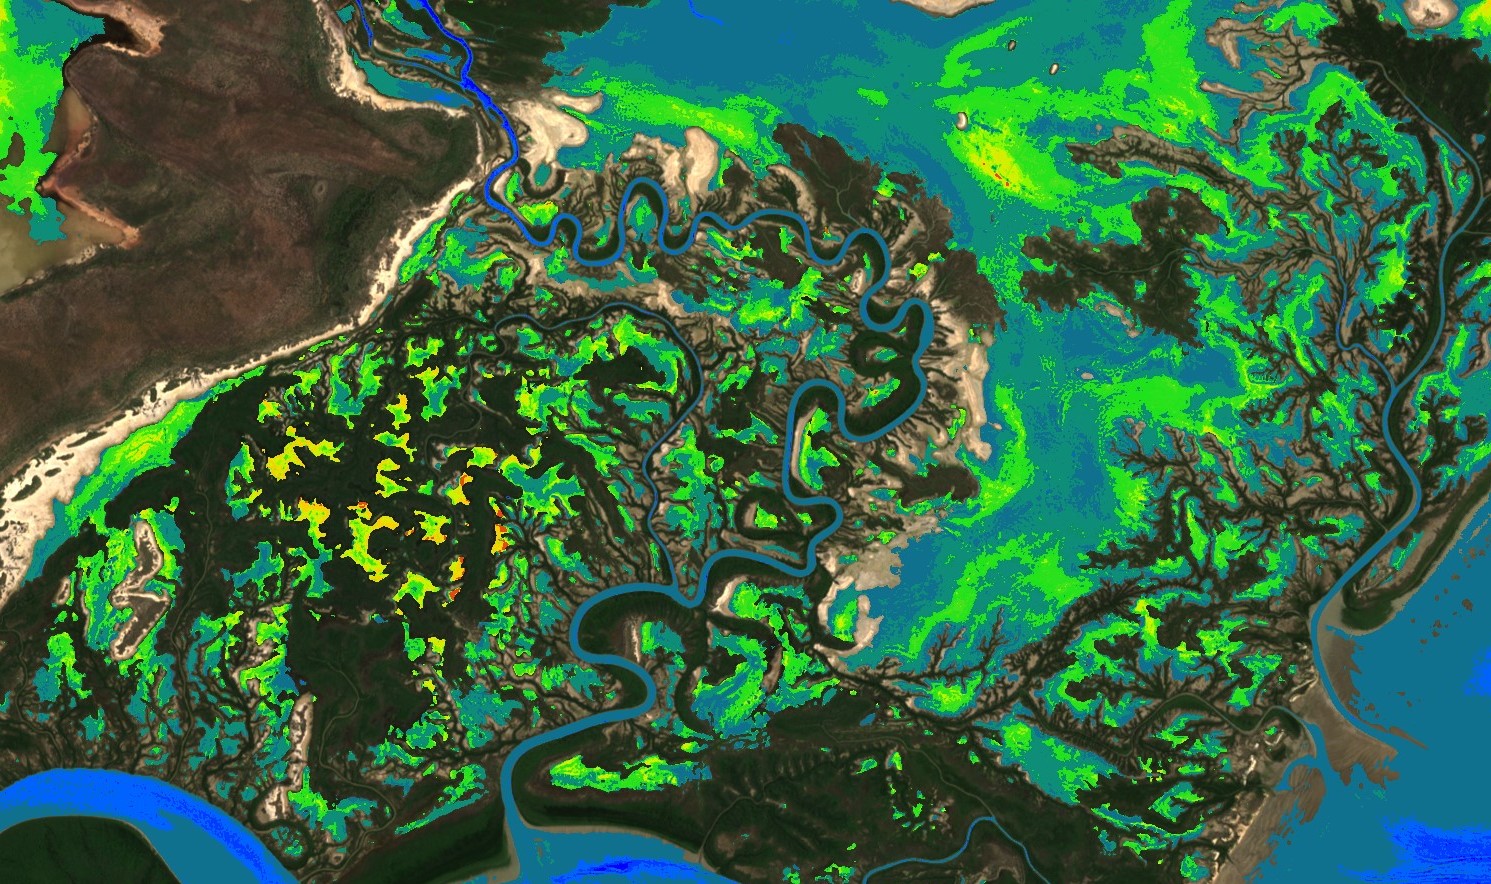
Cyanobacteria Chlorophyll-a NDCI L1C applied to Roper river, Australia. Image acquired on 2019-02-23.
Citation
If making use of this algorithm, please cite as follows:
Kravitz, J & Matthews M., 2020. Chlorophyll-a for cyanobacteria blooms from Sentinel-2. CyanoLakes.