Infrared Agriculture Display Script
/*
Author of the script: Roberto Gagliardi
*/

return [B04*2.5,B08*2.5,B02*2.5];Evaluate and Visualize
General description of the script
Combining band 4 (red), band 8 (nir) and band 2 (blue) on RGB display, vegetation is highlighted so it’s easier to detect crops anomalies, and healthy vegetation can be seen in bright green.
Author of the script
Roberto Gagliardi
Description of representative images
In the image of the 9 de Julio departament, Santa Fe Province, Argentina, it can be clearly seen the areas with good vegetation in green tonalities, and the darker areas correspond to flooded areas that are now begining to get vegetation.
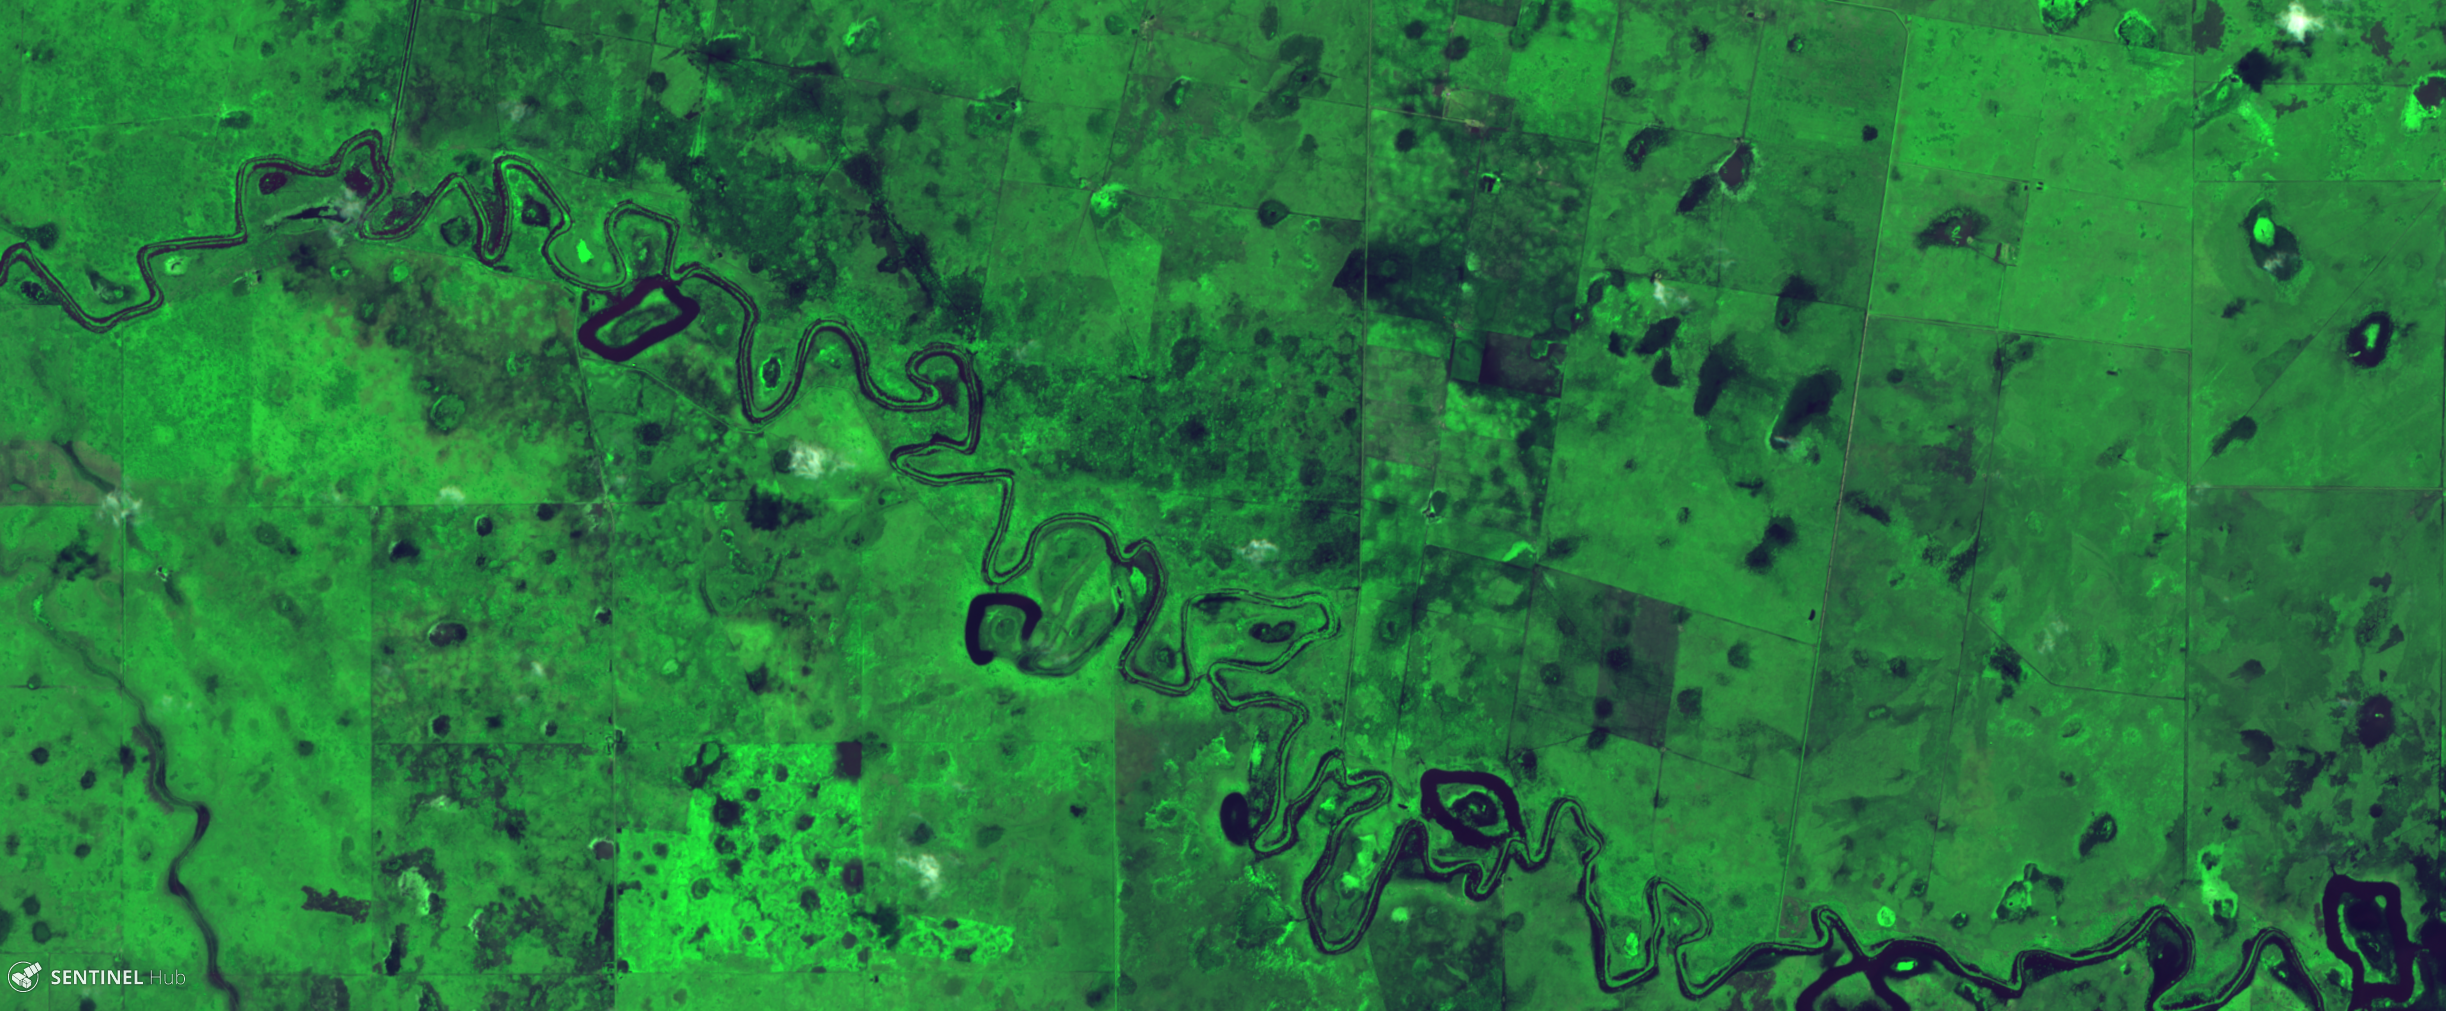 Image: Sentinel 2- L1C, 20 JPN, acquired on 2019-03-18