Sentinel-5P Cloud Top Pressure
//VERSION=3
const band = "CLOUD_TOP_PRESSURE";
var minVal = 10000.0;
var maxVal = 110000.0;

function setup() {
  return {
    input: [band, "dataMask"],
    output: {
      bands: 4,
    },
  };
}

var viz = ColorRampVisualizer.createBlueRed(minVal, maxVal);

function evaluatePixel(samples) {
  let ret = viz.process(samples[band]);
  ret.push(samples.dataMask);
  return ret;
}Evaluate and Visualize
Description
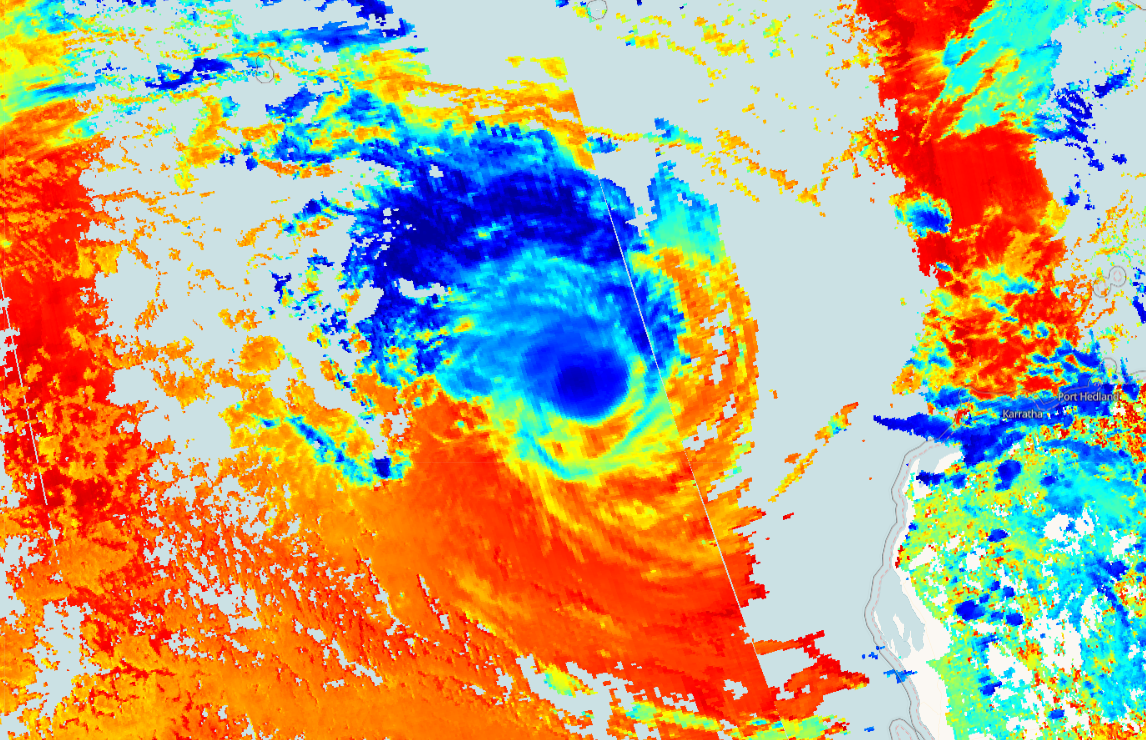
This script visualizes Sentinel 5P top pressure product (air pressure measured at the top of a cloud in Pascal (Pa)).
Description of representative images
Cloud top pressure of the Pacific Ocean hurricane, 2020-01-15.