VI FAPAR visualisation script
//VERSION=3

// This custom script visualises raw FAPAR values

function setup() {
  return {
    input: ["FAPAR", "dataMask"],
    output: { bands: 4 }

  }
}
const map =
  [
    [0.000, 0xFFFFE5],
    [0.125, 0xF7FCB9],
    [0.250, 0xD9F0A3],
    [0.375, 0xADDD8E],
    [0.500, 0x78C679],
    [0.625, 0x41AB5D],
    [0.750, 0x238443],
    [0.875, 0x006837],
    [1.000, 0x004529]
  ]

const visualizer = new ColorMapVisualizer(map);

function evaluatePixel(sample) {
  let rgbVis = visualizer.process(sample.FAPAR * 0.0001);
  return rgbVis.concat(sample.dataMask);
}General description of the script
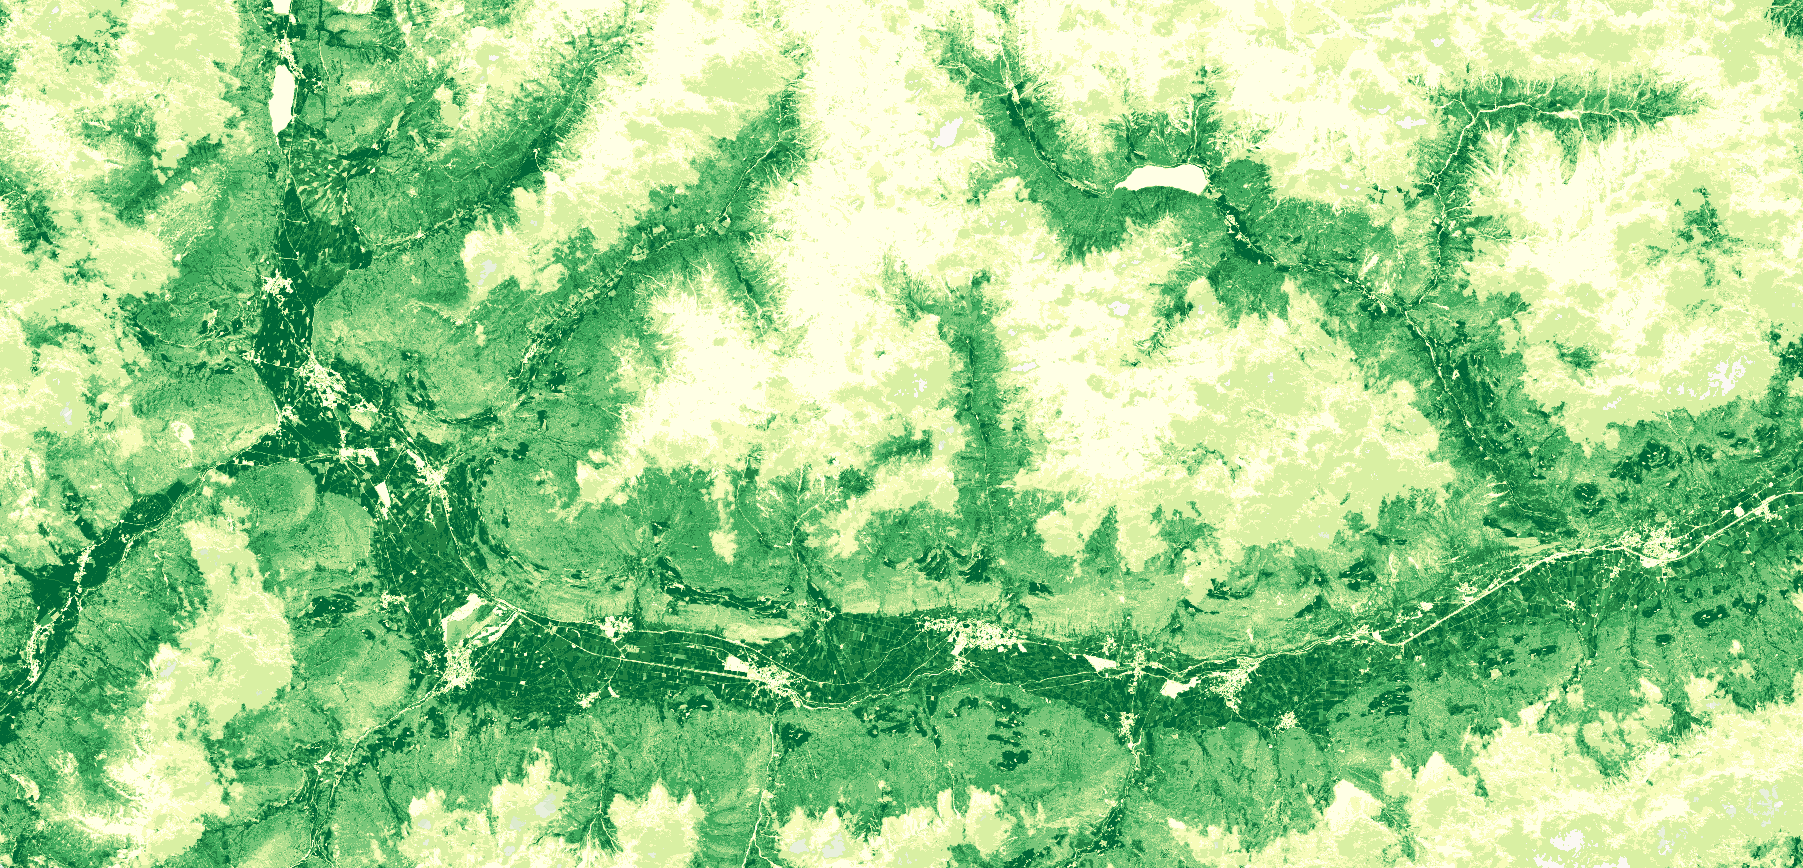
This script visualises raw FAPAR of the VI product. FAPAR corresponds to the fraction of photosynthetically active radiation absorbed by the canopy. FAPAR describes only the green parts of the canopy. FAPAR is very useful in assessing the primary productivity of canopies.
Physical values range from 0 to 1. The color map is adopted from https://github.com/jacobs-tim/copernicus-land-monitoring-service-hrvpp-colourmaps
Description of representative images
August, 2020 FAPAR over South Tyrol Northern Italy