VI LAI visualisation script
//VERSION=3

// This custom script visualises raw LAI values

function setup() {
  return {
    input: ["LAI", "dataMask"],
    output: { bands: 4 }

  }
}
const map =
  [
    [0.000, 0xFFFFE5],
    [1.000, 0xF7FCB9],
    [2.000, 0xD9F0A3],
    [3.000, 0xADDD8E],
    [4.000, 0x78C679],
    [5.000, 0x41AB5D],
    [6.000, 0x238443],
    [7.000, 0x006837],
    [8.000, 0x004529]
  ]

const visualizer = new ColorMapVisualizer(map);

function evaluatePixel(sample) {
  let rgbVis = visualizer.process(sample.LAI * 0.002);
  return rgbVis.concat(sample.dataMask);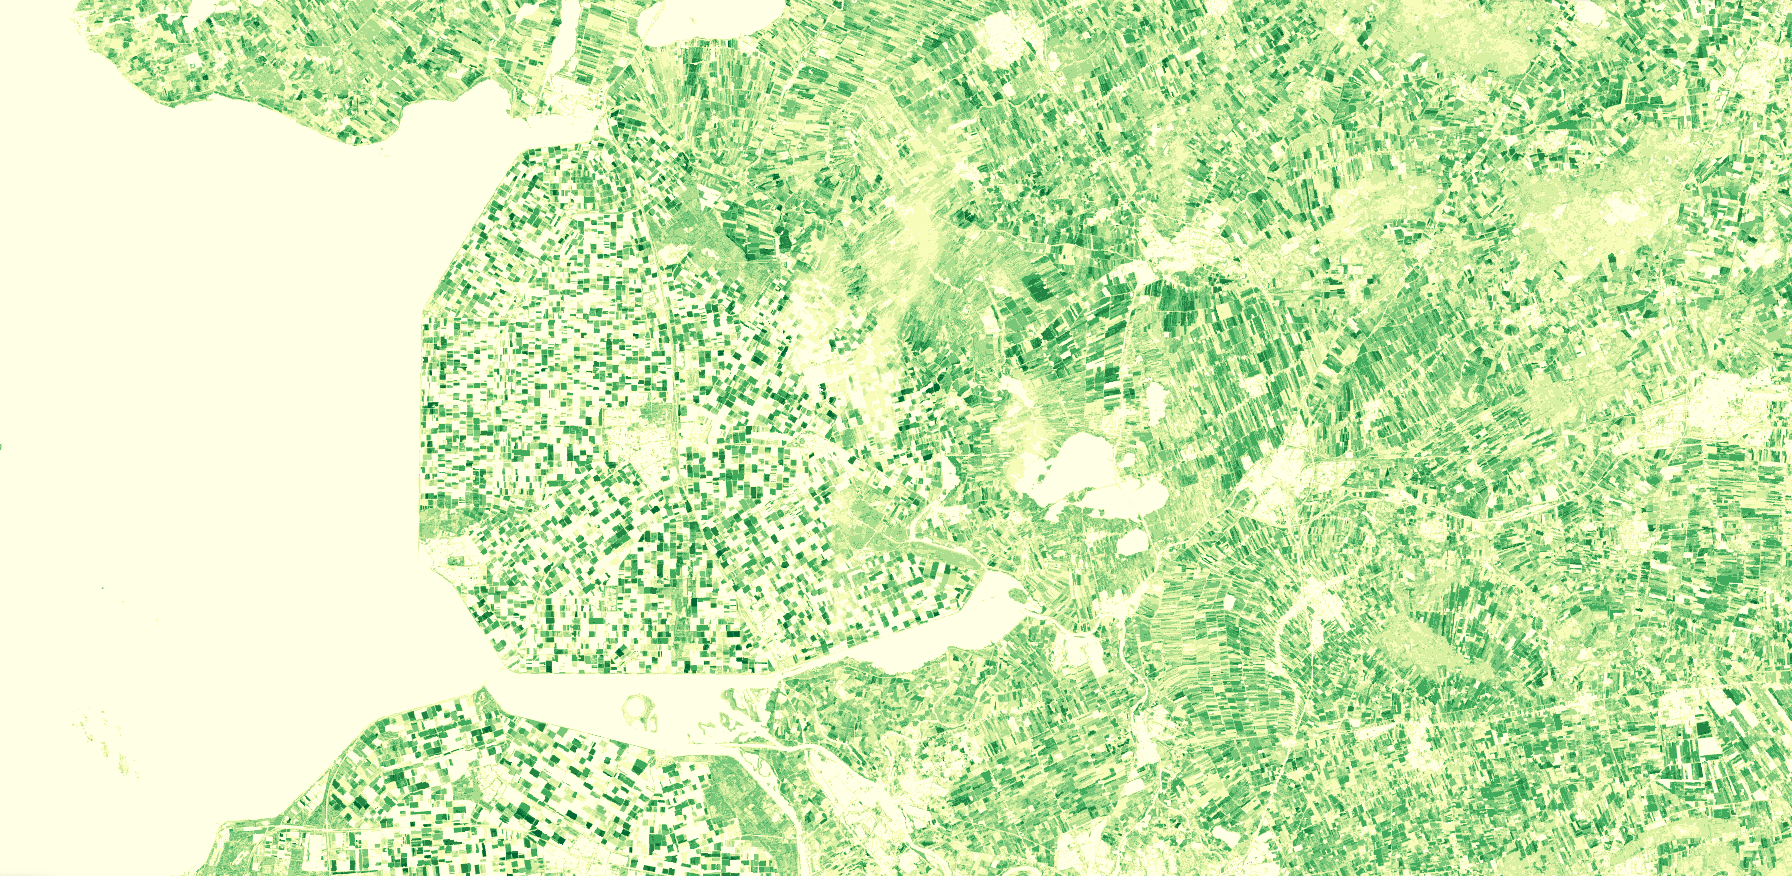
}General description of the script
This script visualises raw LAI of the VI product. LAI is defined as one half of the total area of photosynthetically active elements of the canopy per unit horizontal ground area. The LAI provided by HRVPP corresponds to actual LAI of all the canopy layers, including all green contributors. Practically, the LAI quantifies the thickness of the vegetation cover. Physical values range from 0 to 8.The color map is adopted from https://github.com/jacobs-tim/copernicus-land-monitoring-service-hrvpp-colourmaps
Description of representative images
August, 2020 LAI over Emmeloord, Flevoland Netherlands