VI NDVI visualisation script
//VERSION=3

// This custom script visualises raw NDVI values

function setup() {
  return {
    input: ["NDVI", "dataMask"],
    output: { bands: 4 }
  };
}
const map =
  [[-1, 0xFFFFFF],
  [-0.5, 0xFEFEF3],
  [0.00, 0xFFFFE5],
  [0.10, 0xF7FCB9],
  [0.20, 0xD9F0A3],
  [0.35, 0xADDD8E],
  [0.50, 0x78C679],
  [0.65, 0x41AB5D],
  [0.80, 0x238443],
  [0.90, 0x006837],
  [1.00, 0x004529]
  ]
const visualizer = new ColorMapVisualizer(map);

function evaluatePixel(sample) {
  let rgbVis = visualizer.process(sample.NDVI * 0.0001);
  return rgbVis.concat(sample.dataMask);
}General description of the script
This script visualises raw NDVI of the VI product. NDVI quantifies vegetation photosynthetic capacity by measuring the difference between the Near-Infrared (NIR) (which vegetation strongly reflects) and red spectral bands (which vegetation absorbs). Although it is not a physical property of vegetation cover, NDVI is widely used as an indicator for live green vegetation monitoring.
Physical values range from -1 to 1.he color map is adopted from https://github.com/jacobs-tim/copernicus-land-monitoring-service-hrvpp-colourmaps
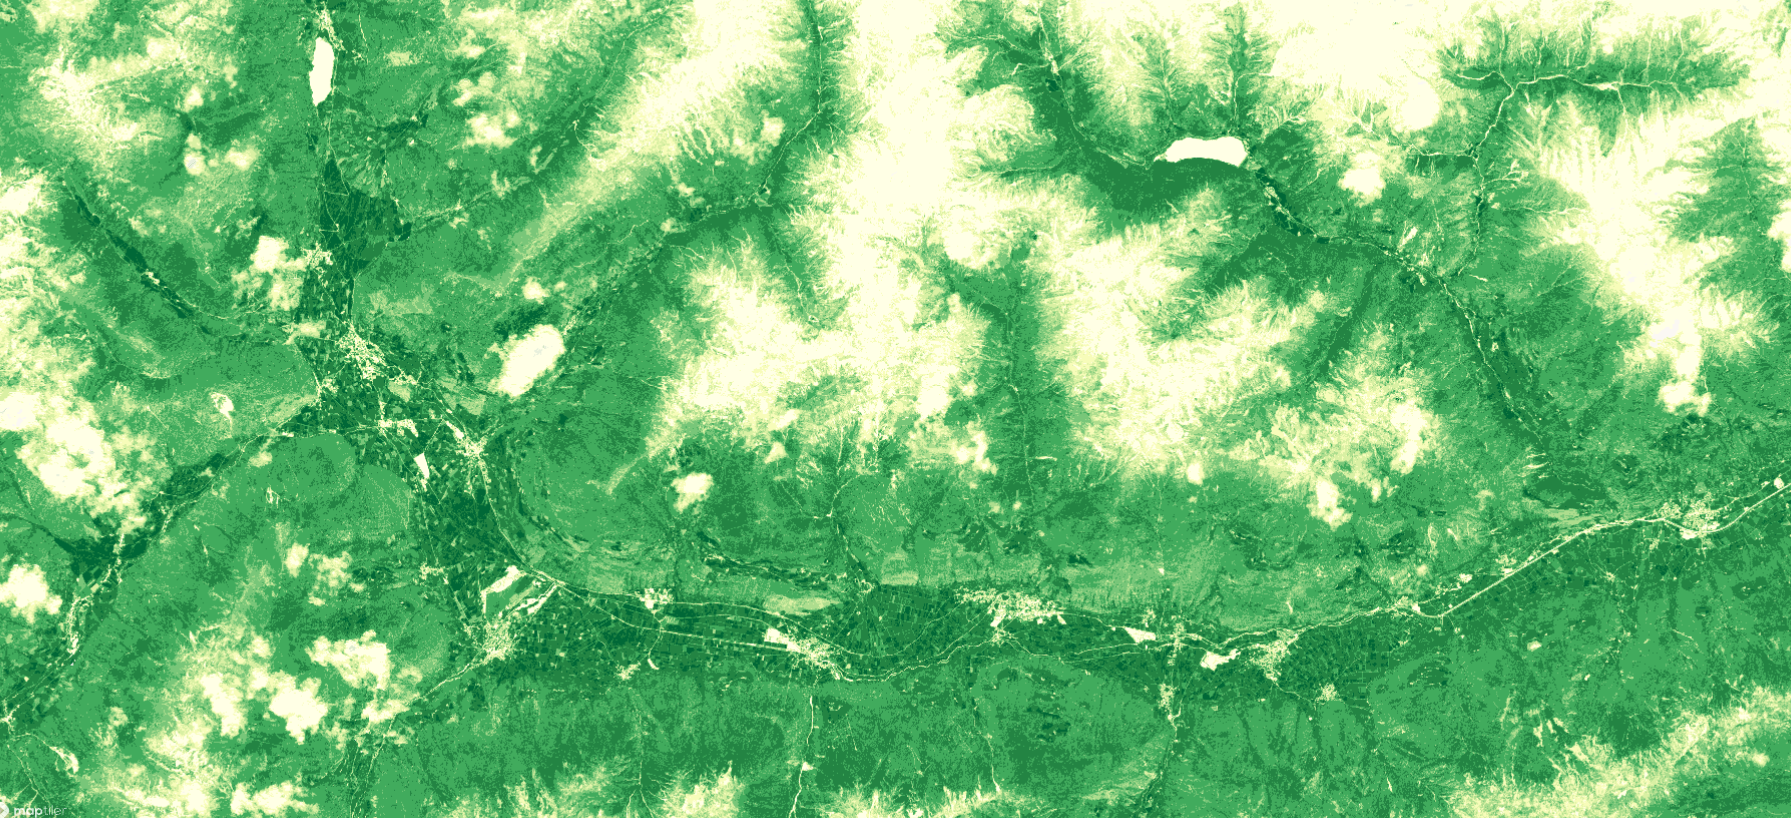
Description of representative images
August, 2020 NDVI over South Tyrol Northern Italy