VI PPI visualisation script
//VERSION=3

// This custom script visualises raw PPI values

function setup() {
  return {
    input: ["PPI", "dataMask"],
    output: { bands: 4 }

  }
}
const map =
  [
    [0.000, 0xFFFFE5],
    [0.375, 0xF7FCB9],
    [0.750, 0xD9F0A3],
    [1.125, 0xADDD8E],
    [1.500, 0x78C679],
    [1.875, 0x41AB5D],
    [2.250, 0x238443],
    [2.625, 0x006837],
    [3.000, 0x004529]
  ]

const visualizer = new ColorMapVisualizer(map);

function evaluatePixel(sample) {
  let rgbVis = visualizer.process(sample.PPI * 0.0001);
  return rgbVis.concat(sample.dataMask);
}General description of the script
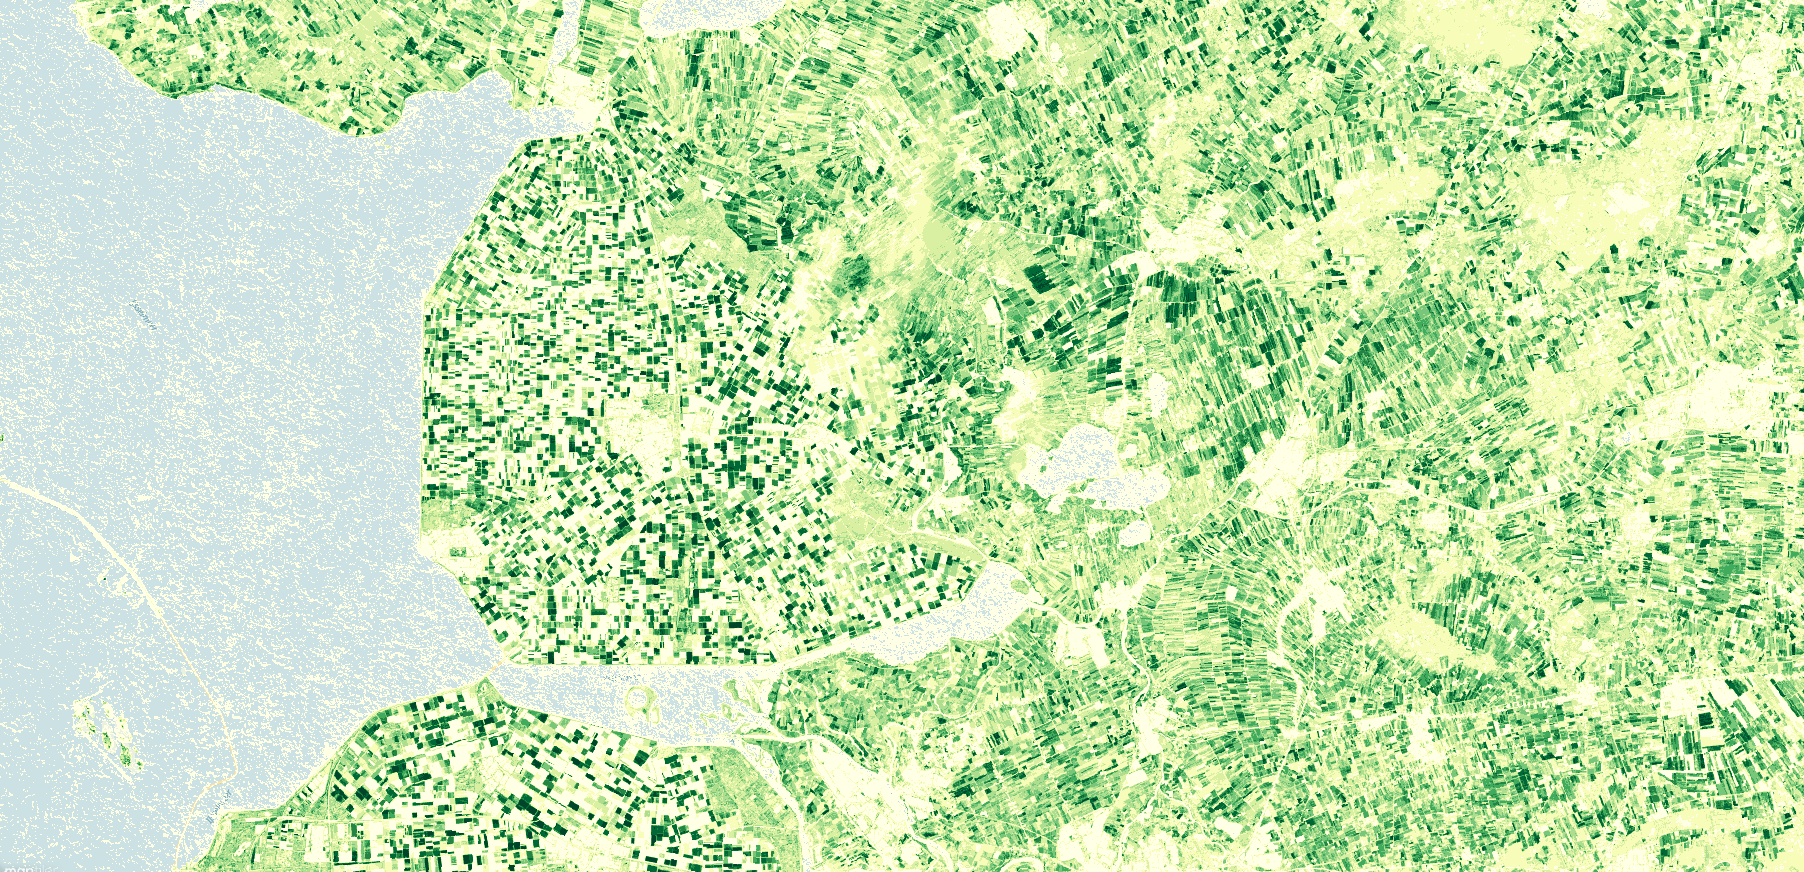
This script visualises raw PPI of the VI product. PPI is a physically-based vegetation index derived from radiative transfer equation and is is calculated from red and Near-Infrared (NIR) spectral bands. PPI is linearly related to green leaf area index, and can be used to track canopy green foliage dynamics and therefore provides an efficient approach to retrieving plant phenology.
Physical values range from 0 to 3.The color map is adopted from https://github.com/jacobs-tim/copernicus-land-monitoring-service-hrvpp-colourmaps
Description of representative images
August, 2020 PPI over Emmeloord, Flevoland Netherlands