VPP AMPL visualisation script
//VERSION=3

// This custom script visualises AMPL (Amplitude)  parameter

function setup() {
  return {
    input: ["AMPL", "dataMask"],
    output: { bands: 4 },
    mosaicking: Mosaicking.TILE
  }
}
const map =
  [
    [0.000, 0xFFFFE5],
    [0.375, 0xF7FCB9],
    [0.750, 0xD9F0A3],
    [1.1250, 0xADDD8E],
    [1.5000, 0x78C679],
    [1.8750, 0x41AB5D],
    [2.2500, 0x238443],
    [2.6250, 0x006837],
    [3.0000, 0x004529]
  ]

const visualizer = new ColorMapVisualizer(map);

function evaluatePixel(samples) {
  for (let i = 0; i < samples.length; i++) {
    let sample = samples[i];
    if (sample.dataMask == 1) {
      let rgbVis = visualizer.process(sample.AMPL * 0.0001);
      return rgbVis.concat(sample.dataMask);
    }
  }
}General description of the script
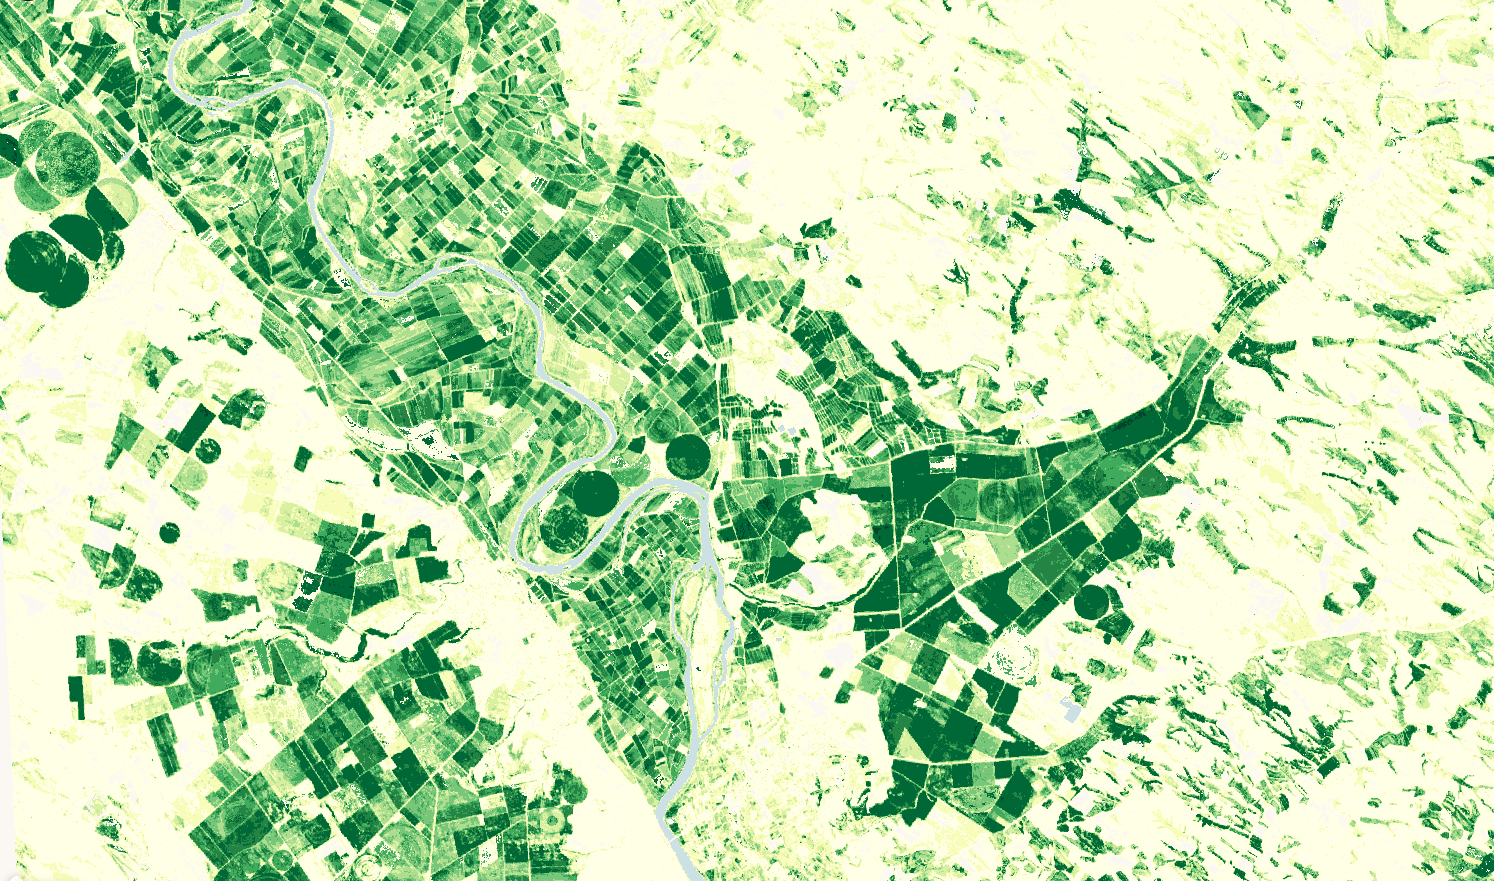
This script visualises Amplitude (AMPL) parameter of the VPP product. The color map is adopted from https://github.com/jacobs-tim/copernicus-land-monitoring-service-hrvpp-colourmaps
Description of representative images
2019 season 1 amplitude over Pina de Ebro Zaragoza Spain