CLMS HR-S&I: Sentinel-1 and Sentinel-2 River and Lake Ice Extent quality layer visualisation script
//VERSION=3
function setup() {
  return {
    input: ["QC", "dataMask"],
    output: {
      bands: 4,
      sampleType: "Auto"
    }
  };

}

const map = [
  [0, 0x5DA400],  //0 - High quality
  [1, 0xBDBD5B],  //1 - Medium quality
  [2, 0xFFC000],  //2 - Low quality
  [3, 0xFF0000],  //3 - Minimal quality
  [205, 0x7B7B7B],  //205 - Cloud or cloud shadow
  [255, 0xFFFFFF],  //255 - No data
];

const visualizer = new ColorMapVisualizer(map);

function evaluatePixel(sample) {
  let rgbVis = visualizer.process(sample.QC);
  return rgbVis.concat(sample.dataMask);
}General description of the script
This script visualises the Sentinel 1 and 2-based River and Lake Ice Extent quality layer.
Table 1: Classification classes and colouring scheme.
| Value | Color | Label |
|---|---|---|
| 0 | high quality | |
| 1 | medium quality | |
| 2 | low quality | |
| 3 | minimal quality | |
| 205 | cloud or cloud shadow | |
| 255 | no data |
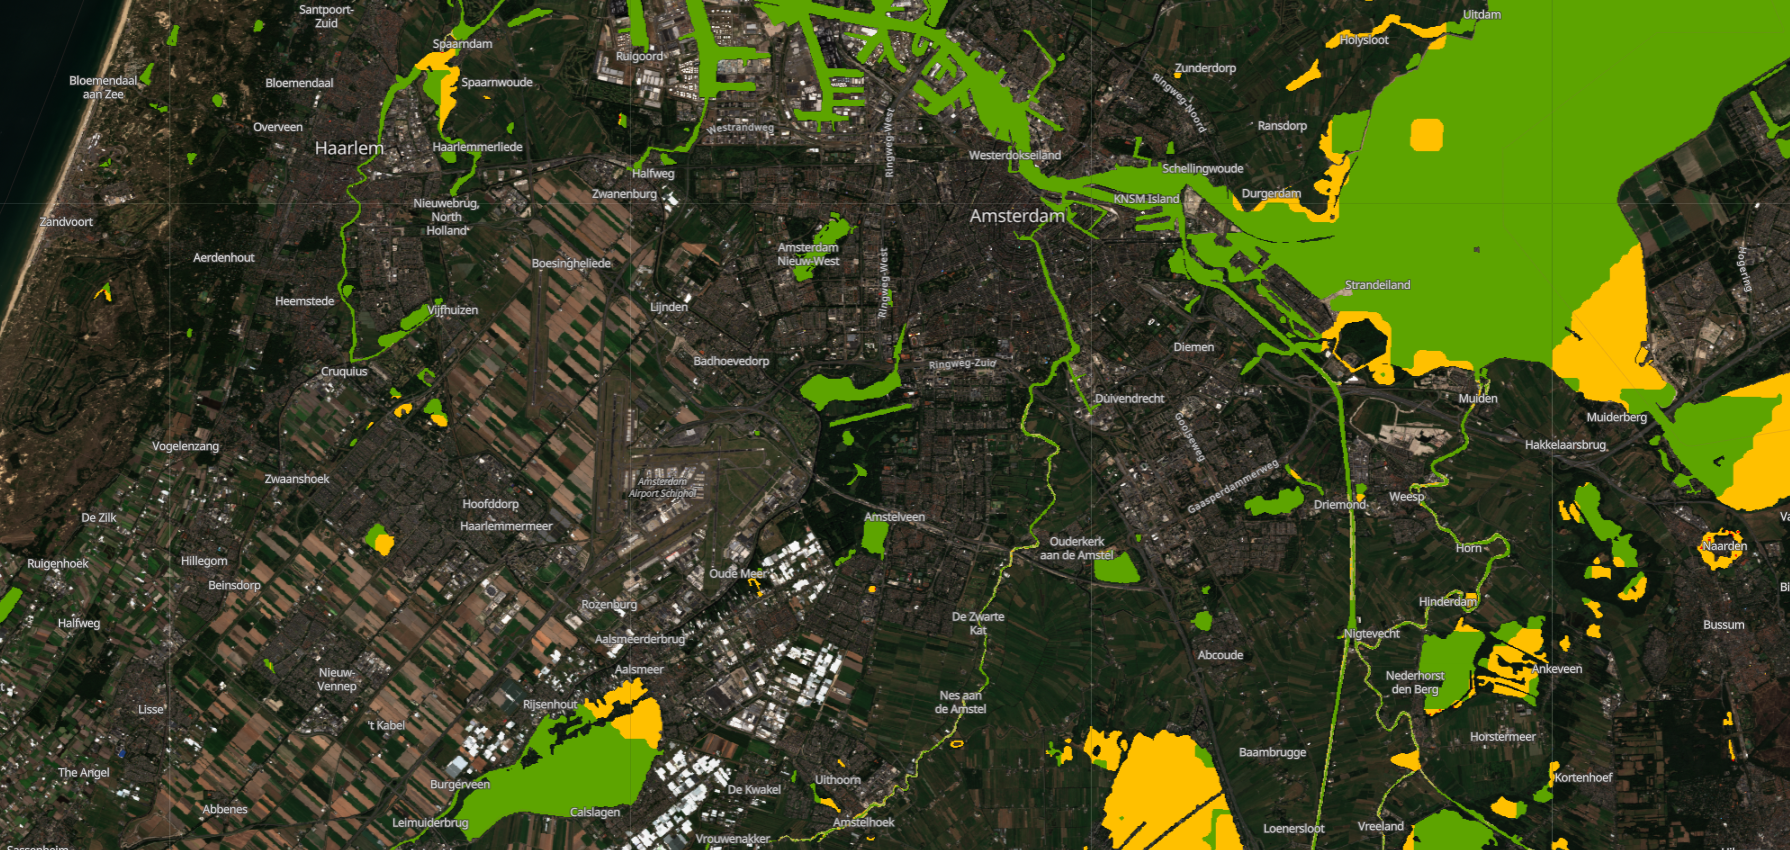
Description of representative images
09th June 2021, Amsterdam, NL