DEM Contour Lines
//DEM dontour lines

var d = DEM;
if (d % 35 < 5) {
  return [0,0,0]
}
var c = 20 * Math.floor(d / 20);
return colorBlend(c, [-12000,-9000,-6000,-1000,-500,-200,-50,-20,-10,0,10,30,50,200,300,400,500,1000,3000,5000,7000,9000],
[[0.000, 0.000, 0.157],
[0.118, 0.000, 0.353],
[0.118, 0.118, 0.471],
[0.157, 0.196, 0.706],
[0.235, 0.235, 0.902],
[0.235, 0.314, 0.961],
[0.353, 0.333, 0.980],
[0.471, 0.471, 0.922],
[0.627, 0.627, 1.000],
[0.784, 0.784, 0.784],
[0.392, 0.220, 0.235],
[0.471, 0.180, 0.157],
[0.549, 0.298, 0.157],
[0.667, 0.376, 0.000],
[0.471, 0.220, 0.353],
[0.824, 0.573, 0.706],
[0.549, 0.431, 0.000],
[0.471, 0.549, 0.706],
[0.627, 0.667, 0.941],
[0.745, 0.784, 0.980],
[0.863, 0.941, 1.000],
[1.000, 1.000, 1.000]])Description
This script uses DEM to calculate and display contour lines. They are calculated using c = 20 * Math.floor(d / 20). The visualization can be manipulated in a number of ways. The number 35 in the first conditional statement below sets the increments between the contour lines; in this case, the spacing between the contour lines means that the elevation difference between them is 35 meters. This means, that the contour lines will be further apart where the elevation is lower. The number 5 in the script below sets the contour line thickness to be pretty low. The first return statement return [0,0,0] sets the color of the contour lines to black, and the colorBlend maps the areas in between in terrain colors, based on the terrain elevation model borders.
Representative Images and Examples
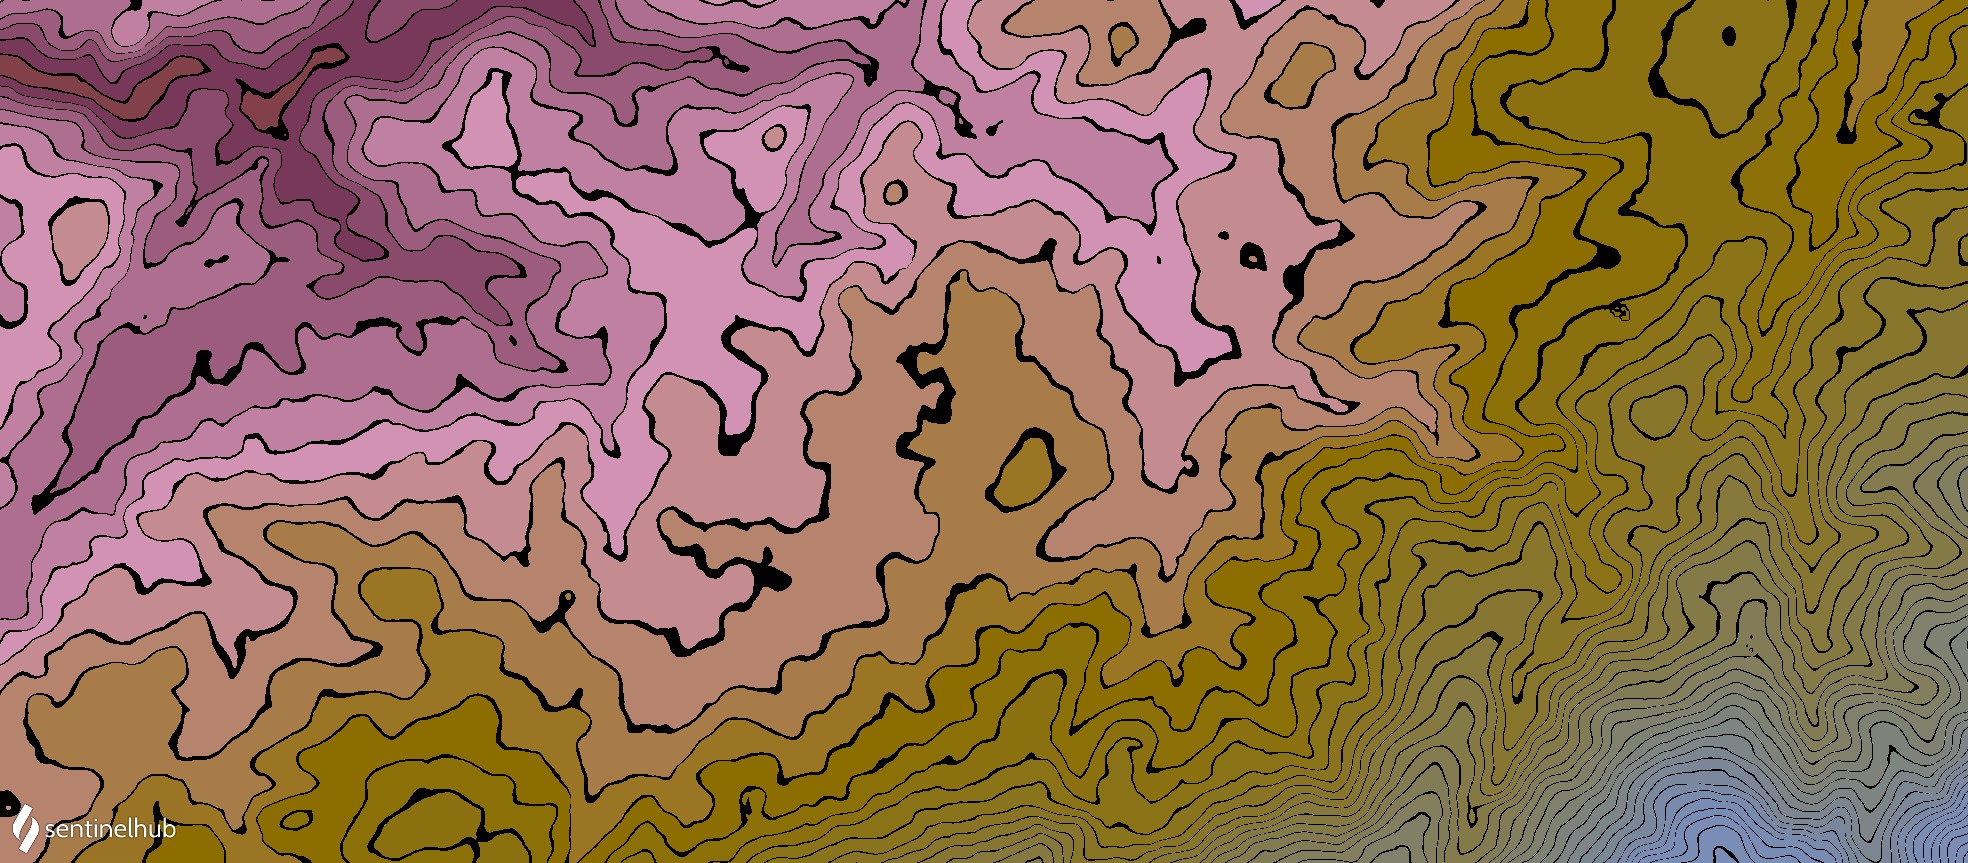
Example 1
The following example will return black contour lines of thickness 5 in 35 meter increments on top of our standard DEM continuous color visualization.
var d = DEM;
if (d % 35 < 5) {
    return [0, 0, 0];
}
var c = 20 * Math.floor(d / 20);
return colorBlend(
    c,
    [
        -12000, -9000, -6000, -1000, -500, -200, -50, -20, -10, 0, 10, 30, 50,
        200, 300, 400, 500, 1000, 3000, 5000, 7000, 9000,
    ],
    [
        [0.0, 0.0, 0.157],
        [0.118, 0.0, 0.353],
        [0.118, 0.118, 0.471],
        [0.157, 0.196, 0.706],
        [0.235, 0.235, 0.902],
        [0.235, 0.314, 0.961],
        [0.353, 0.333, 0.98],
        [0.471, 0.471, 0.922],
        [0.627, 0.627, 1.0],
        [0.784, 0.784, 0.784],
        [0.392, 0.22, 0.235],
        [0.471, 0.18, 0.157],
        [0.549, 0.298, 0.157],
        [0.667, 0.376, 0.0],
        [0.471, 0.22, 0.353],
        [0.824, 0.573, 0.706],
        [0.549, 0.431, 0.0],
        [0.471, 0.549, 0.706],
        [0.627, 0.667, 0.941],
        [0.745, 0.784, 0.98],
        [0.863, 0.941, 1.0],
        [1.0, 1.0, 1.0],
    ]
);
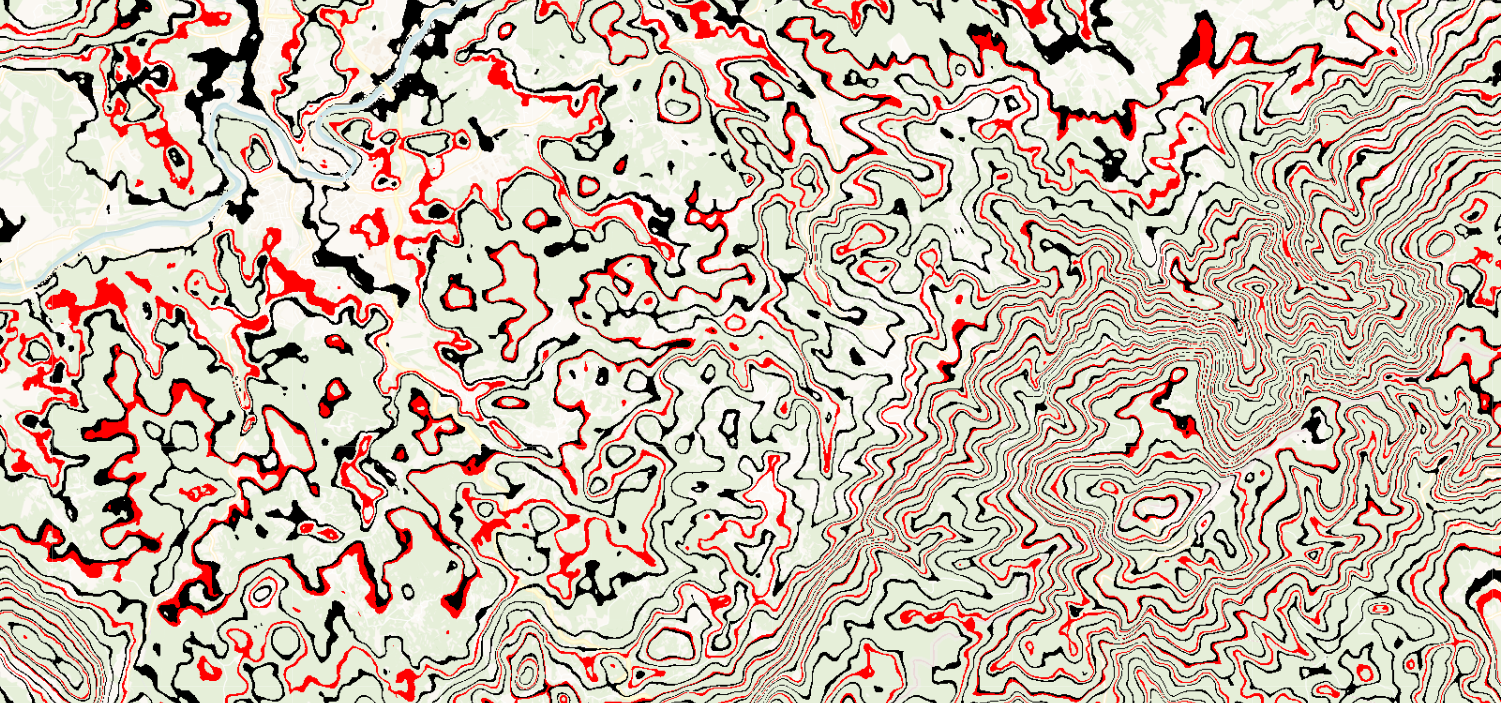
Example 2
We can make multiple contour lines, each in different increments and different color. It’s also possible to return all other values transparent, so that contour lines can be downloaded and overlayed over other datasets. The following example returns 35 meter contour lines in black, 50 meter contour lines in red and all other pixels transparent. On the image, you can see Carto Voyager basemap under the contour lines.
To display this script, either use a processing API, or EO Browser. In EO Browser, data fusion needs to be used to access DEM dataset.
var d = DEM;
if (d % 35 < 5) {
    return [0, 0, 0, 1];
}
if (d % 50 < 5) {
    return [1, 0, 0, 1];
} else {
    return [0, 0, 0, 0];
}
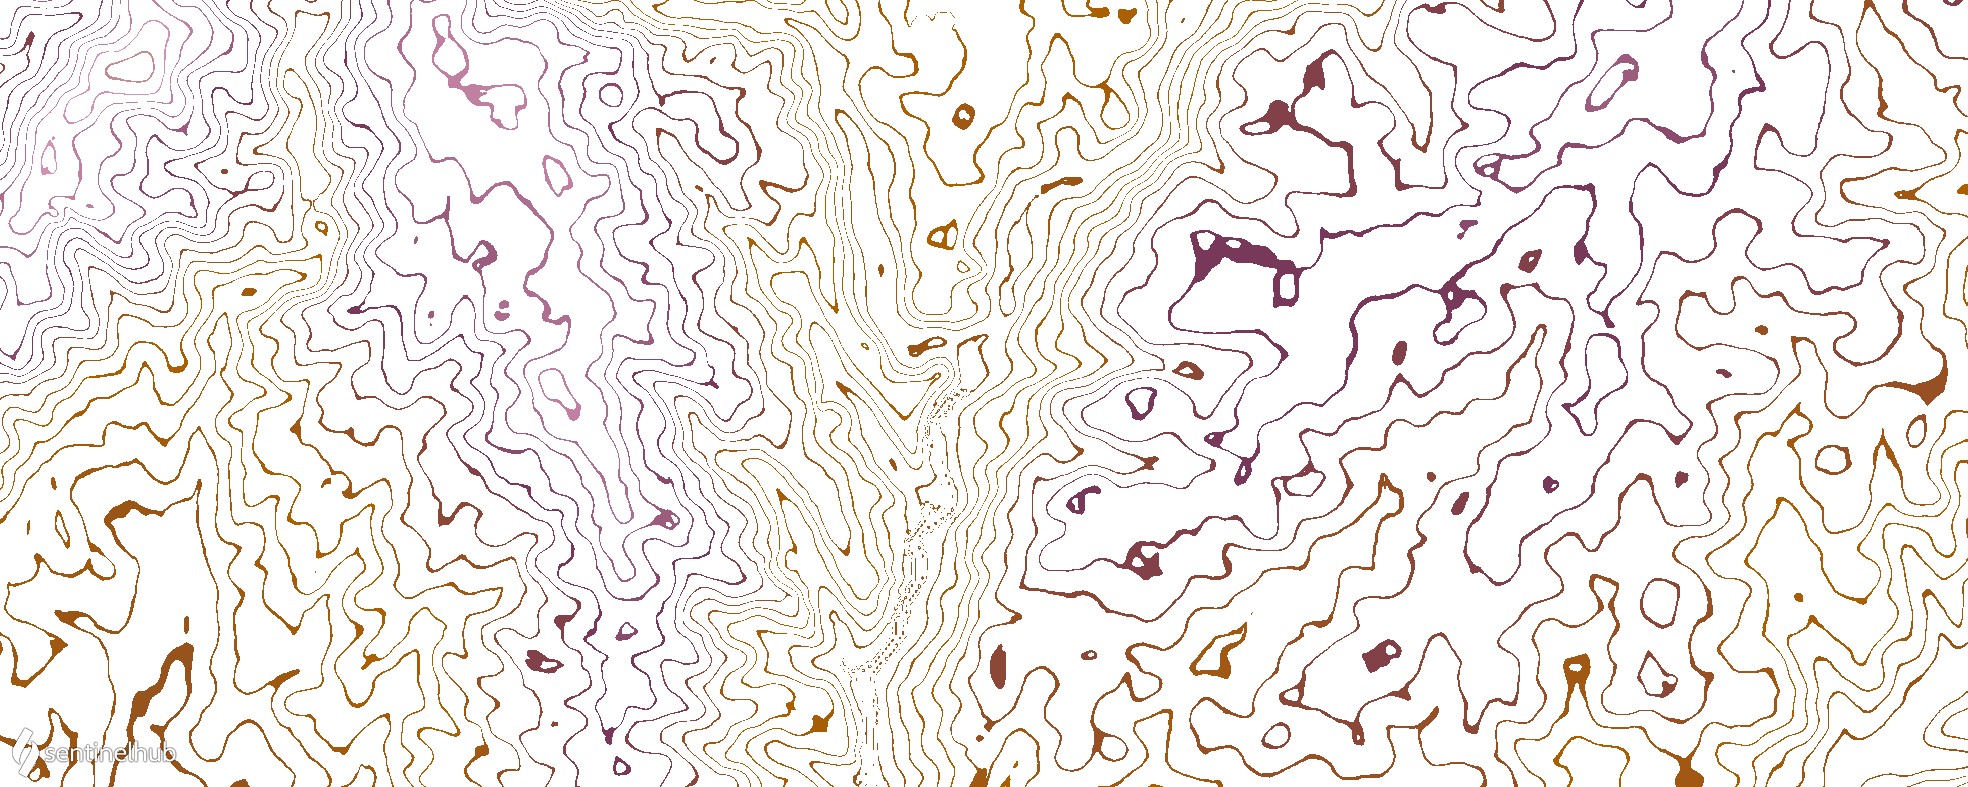
Example 3
Making contour lines very thick and returning them white, while returning everything else using a color visualization, gives the impression of colored contour lines on a white background.
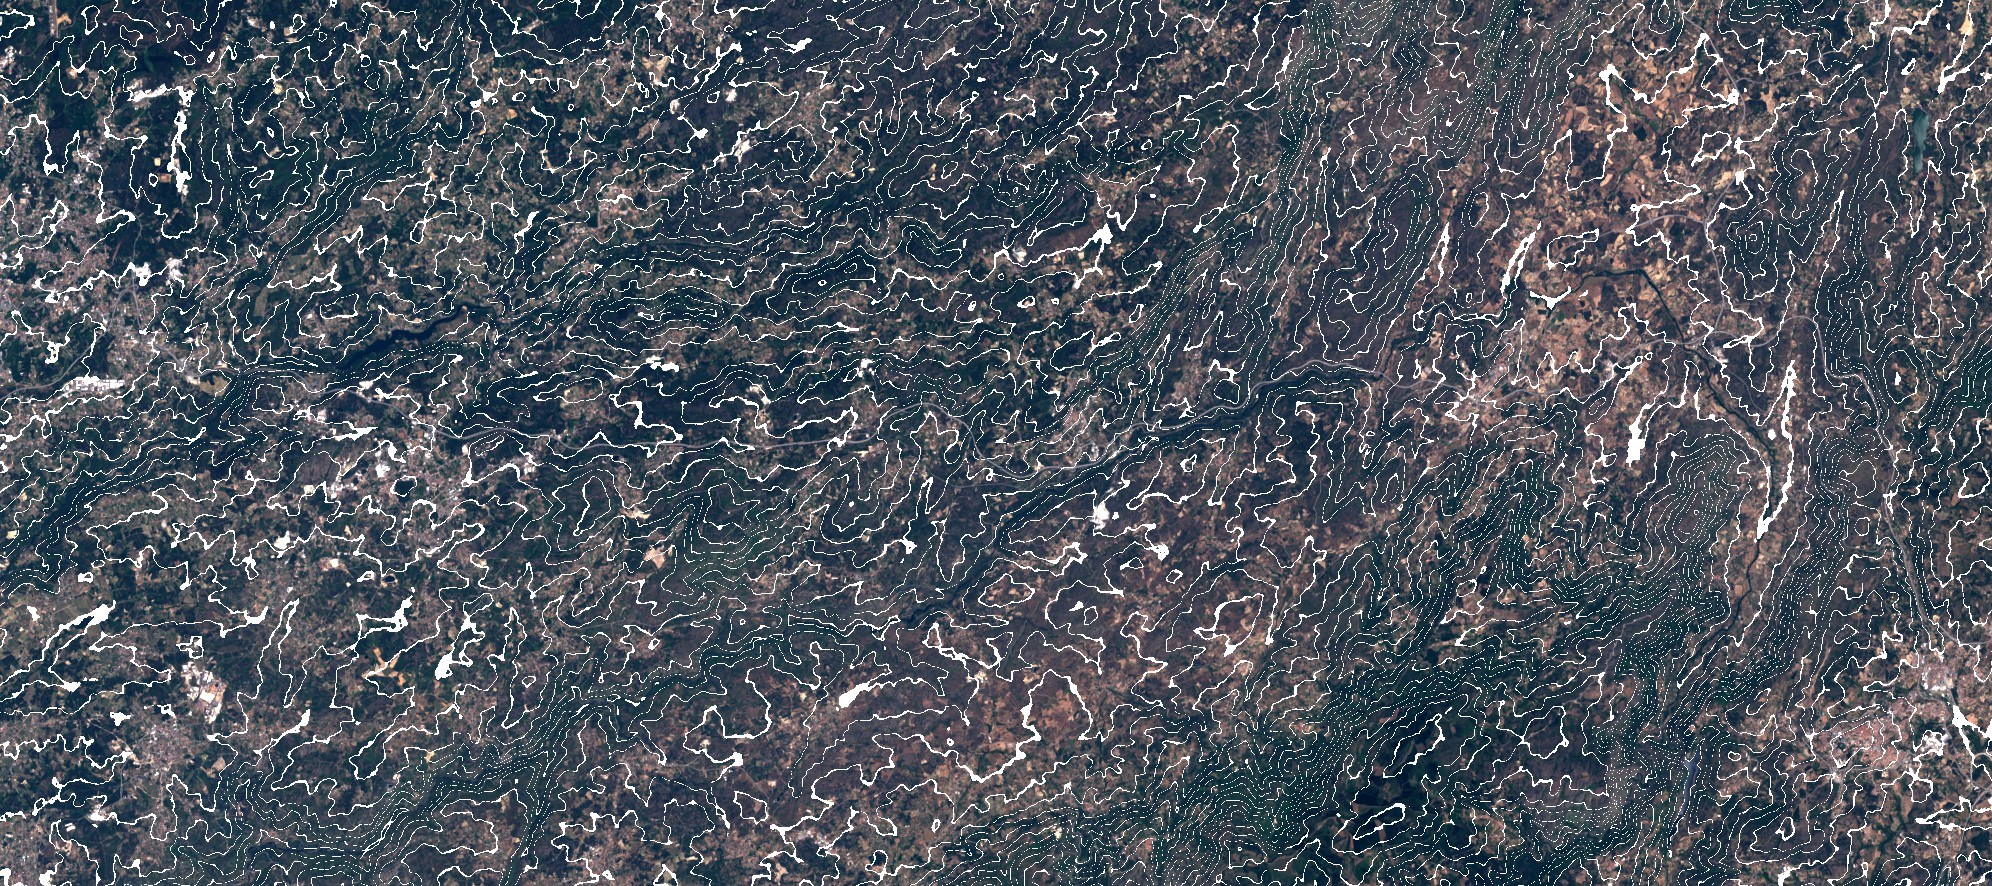
Example 4
It is also possible to return contour lines of any color on top of a true color visualization of anoter satellite. However, for this, data fusion is needed. In the example below, Landsat 8 true color visualization was used under white contour lines.
DEM contour lines over Landsat 8 data fusion script
Authors of the scripts
- Peter Gabrovšek
- Marko Repše
- Monja Šebela