DEM Topographic Visualization
//VERSION=3
// To set custom max and min values, set
// defaultVis to false and choose your max and
// min values. The color map will then be scaled
// to those max and min values

const max = 8000;
const min = -5000;
const seaLevel = 0;

function setup() {
  return {
    input: ["DEM", "dataMask"],
    output: [
      { id: "default", bands: 4, sampleTYPE: "AUTO" },
      { id: "index", bands: 1, sampleType: "FLOAT32" },
      { id: "dataMask", bands: 1 },
    ],
  };
}

const landMap = [
  [8000, 0xffffff],
  [7000, 0xf2f2f2],
  [6000, 0xe5e5e5],
  [5500, 0x493811],
  [5000, 0x5e4c26],
  [4500, 0x726038],
  [4000, 0x87724c],
  [3500, 0x998760],
  [3000, 0xad9b75],
  [2500, 0xc1af89],
  [2000, 0xd6c49e],
  [1500, 0xead8af],
  [1000, 0xfcedbf],
  [900, 0xaadda0],
  [800, 0xa5d69b],
  [700, 0x96ce8e],
  [600, 0x84c17a],
  [500, 0x7aba70],
  [400, 0x72b266],
  [300, 0x5ea354],
  [200, 0x4c933f],
  [100, 0x3d873d],
  [75, 0x357c3a],
  [50, 0x2d722d],
  [25, 0x266821],
  [10, 0x1e5e14],
  [0, 0x165407],
];

// add ocean color
const waterMap = [
  [-5, 0xa8d1ea],
  [-50, 0x89a8d1],
  [-100, 0x687fba],
  [-500, 0x4759a0],
  [-1000, 0x283087],
  [-5000, 0x070772],
];
const landVis = new ColorRampVisualizer(landMap, seaLevel, max);
const waterVis = new ColorRampVisualizer(waterMap, min, seaLevel);

function evaluatePixel(sample) {
  let val = sample.DEM;
  let imgVals = val > seaLevel ? landVis.process(val) : waterVis.process(val);

  // Return the 4 inputs and define content for each one
  return {
    default: [...imgVals, sample.dataMask],
    index: [val],
    dataMask: [sample.dataMask],
  };
}
//VERSION=3
// To set custom max and min values, set
// choose your max and min values.
// The color map will then be scaled
// to those max and min values
const max = 8000;
const min = 0;
function setup() {
return {
input: ["DEM", "dataMask"],
output: [
{ id: "default", bands: 4, sampleType: "AUTO" },
{ id: "index", bands: 1, sampleType: "FLOAT32" },
{ id: "dataMask", bands: 1 },
],
};
}
const map = [
[8000, 0xffffff],
[7000, 0xf2f2f2],
[6000, 0xe5e5e5],
[5500, 0x493811],
[5000, 0x5e4c26],
[4500, 0x726038],
[4000, 0x87724c],
[3500, 0x998760],
[3000, 0xad9b75],
[2500, 0xc1af89],
[2000, 0xd6c49e],
[1500, 0xead8af],
[1000, 0xfcedbf],
[900, 0xaadda0],
[800, 0xa5d69b],
[700, 0x96ce8e],
[600, 0x84c17a],
[500, 0x7aba70],
[400, 0x72b266],
[300, 0x5ea354],
[200, 0x4c933f],
[100, 0x3d873d],
[75, 0x357c3a],
[50, 0x2d722d],
[25, 0x266821],
[10, 0x1e5e14],
[0.00001, 0x165407],
[0, 0x0f0f8c],
];
const visualizer = new ColorRampVisualizer(map, min, max);
function evaluatePixel(samples) {
const imgVals = visualizer.process(samples.DEM);
// Return the 4 inputs and define content for each one
return {
default: [...imgVals, samples.dataMask],
index: [samples.DEM],
dataMask: [samples.dataMask],
};
}Evaluate and Visualize
Description
Sentinel Hub supports Mapzen DEM and Copernicus DEM. Mapzen DEM is based on SRTM30 (Shuttle Radar Topography Mission) and other sources. Copernicus DEM is based on WorldDEM that is infilled on a local basis with the following DEMs: ASTER, SRTM90, SRTM30, SRTM30plus, GMTED2010, TerraSAR-X Radargrammetric DEM, ALOS World 3D-30m. More information can be found in our documentation.
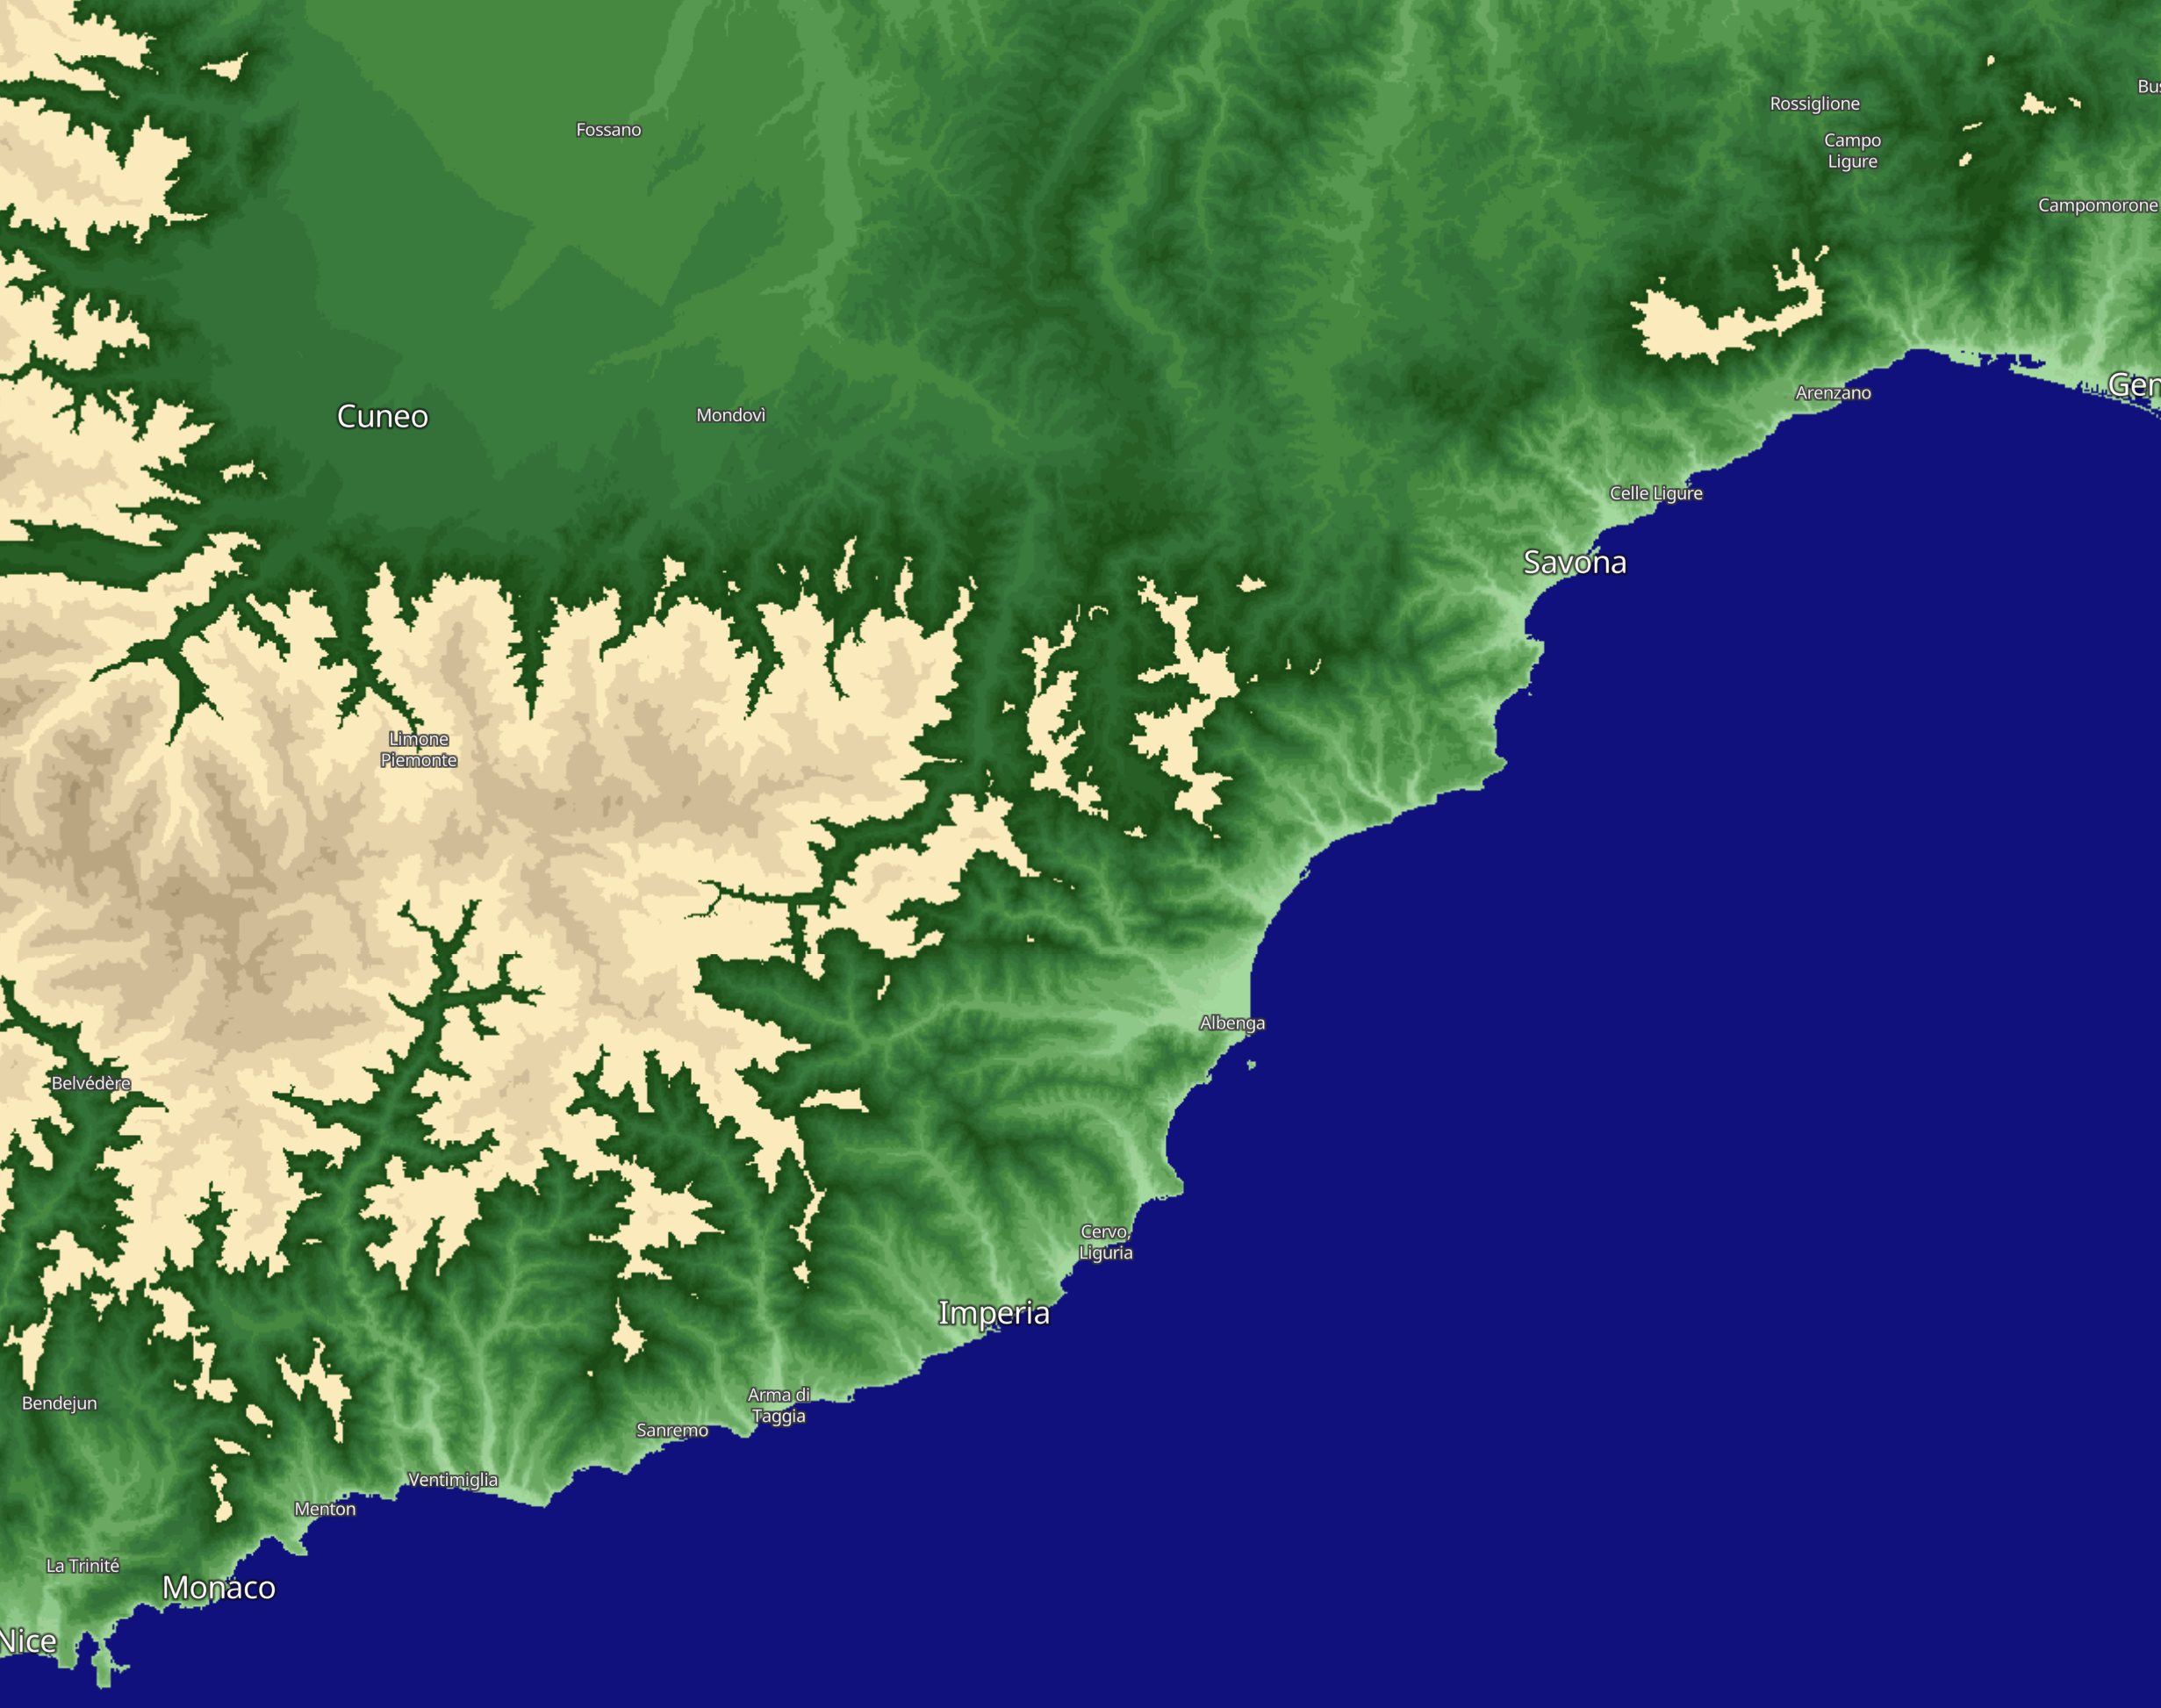
This script returns a visualisation with green colours representing lowland elevations and earth colours as mountainous elevations. The script uses discrete classes rather than the continuous visualisations in the other DEM evalscripts in this repository.
Color table
| Elevation range | HTLM color code | Color |
|---|---|---|
| Below Sea Level | #0f0f8c | |
| 0-10m | #175408 | |
| 10-25m | #1f5e14 | |
| 25-50m | #266921 | |
| 50-75m | #2e732e | |
| 75-100m | #367d3b | |
| 100-200m | #3d873d | |
| 200-300m | #4d9440 | |
| 300-400m | #5ea354 | |
| 400-500m | #73b366 | |
| 500-600m | #7aba70 | |
| 600-700m | #85c27a | |
| 700-800m | #96cf8f | |
| 800-900m | #a6d69c | |
| 900-1000m | #abdea1 | |
| 1000-1500m | #fcedbf | |
| 1500-2000m | #ebd9b0 | |
| 2000-2500m | #d6c49e | |
| 2500-3000m | #c2b08a | |
| 3000-3500m | #ad9c75 | |
| 3500-4000m | #998761 | |
| 4000-4500m | #87734d | |
| 4500-5000m | #736138 | |
| 5000-5500m | #5e4d26 | |
| 5500-6000m | #4a3812 | |
| 6000-7000m | #e6e6e6 | |
| 7000-8000m | #f2f2f2 | |
| 8000m + | #ffffff |
Author of the script
William Ray