Markuse fire
//VERSION=3
// Landsat 8/9 Intensified Fire Glow Script
// Based on the Pierre Markuse wildfire script, edited using AI by András Zlinszky, Sinergise

function setup() {
  return {
    input: ["B02", "B03", "B04", "B10", "dataMask"],
    output: { bands: 3 }
  };
}

function evaluatePixel(sample) {
  if (sample.dataMask === 0) return [0, 0, 0];

  // 1. DATA NORMALIZATION (B10 -> Celsius)
  var b10 = sample.B10;
  var LST_C = 0;
  if (b10 > 200) {
    LST_C = (b10 > 1000) ? (b10 * 0.1) - 273.15 : b10 - 273.15;
  } else {
    var K1 = 774.8853;
    var K2 = 1321.0789;
    LST_C = (K2 / Math.log(K1 / (b10 + 0.0001) + 1)) - 273.15;
  }

  // 2. TRUE COLOR BASE (Slightly darkened for better contrast with fire)
  var brightness = 1.8;
  var R = sample.B04 * brightness;
  var G = sample.B03 * brightness;
  var B = sample.B02 * brightness;

  // 3. INTENSE FIRE PARAMETERS
  var minFireC = 45;  // Threshold to start the red glow
  var maxFireC = 115; // Threshold for white-hot center

  if (LST_C > minFireC) {
    // Normalize heat value
    var val = (LST_C - minFireC) / (maxFireC - minFireC);
    val = Math.min(Math.max(val, 0), 1);

    // --- INTENSIFIED RED GLOW LOGIC ---
    // We use Math.pow to create a steep curve.
    // Deep Red starts early; Yellow/White only appears at very high temps.

    var redIntensifier = val * 2.5;            // Strong red base
    var yellowIntensifier = Math.pow(val, 3);  // Yellow kicks in late (intense heat)
    var whiteIntensifier = Math.pow(val, 5);   // White only for the core

    // Apply colors using an additive blend (Screen-like effect)
    R = R + redIntensifier;
    G = G + (yellowIntensifier * 0.8) + (whiteIntensifier * 0.5);
    B = B + (whiteIntensifier * 0.8);

    // Optional: Add a slight "bloom" to the red channel
    R *= 1.2;
  }

  return [R, G, B];
}Evaluate and Visualize
General description
This script highlights active fire on Landsat 8/9 imagery by combining a true-color base with an intensified thermal glow. This script is based on the algorithm developed for wildfire monitoring by Pierre Markuse, enhancing the thermal signal from the Landsat thermal bands instead of the SWIR bands of Sentinel-2 (see the original Markuse fire script for Sentinel-2).
The visualization is built in three steps:
- Thermal normalization — the thermal band B10 is converted to a temperature in degrees Celsius. The script accepts B10 in different scalings: already-Celsius/Kelvin values, scaled digital numbers, or raw values, which are converted to brightness temperature using the Landsat TIRS calibration constants (
K1 = 774.8853,K2 = 1321.0789). - True-color base — a slightly darkened true color image (
B04,B03,B02) provides the geographic context and improves the contrast of the fire glow. - Intensified fire glow — where the temperature exceeds
minFireC(45 °C), an additive red→yellow→white glow is blended onto the base. The intensity ramps up tomaxFireC(115 °C) for the white-hot core.Math.powcurves keep the glow deep red for moderate heat and reserve yellow and white for the most intense pixels.
You can tune the minFireC and maxFireC thresholds at the top of the script to adjust the sensitivity of the glow. Note this is a per-pixel script (Sentinel Hub evalscripts have no access to neighbouring pixels), so it visualizes thermal anomalies but does not measure or cluster them — that kind of spatial analysis is a downstream step.
Description of representative images
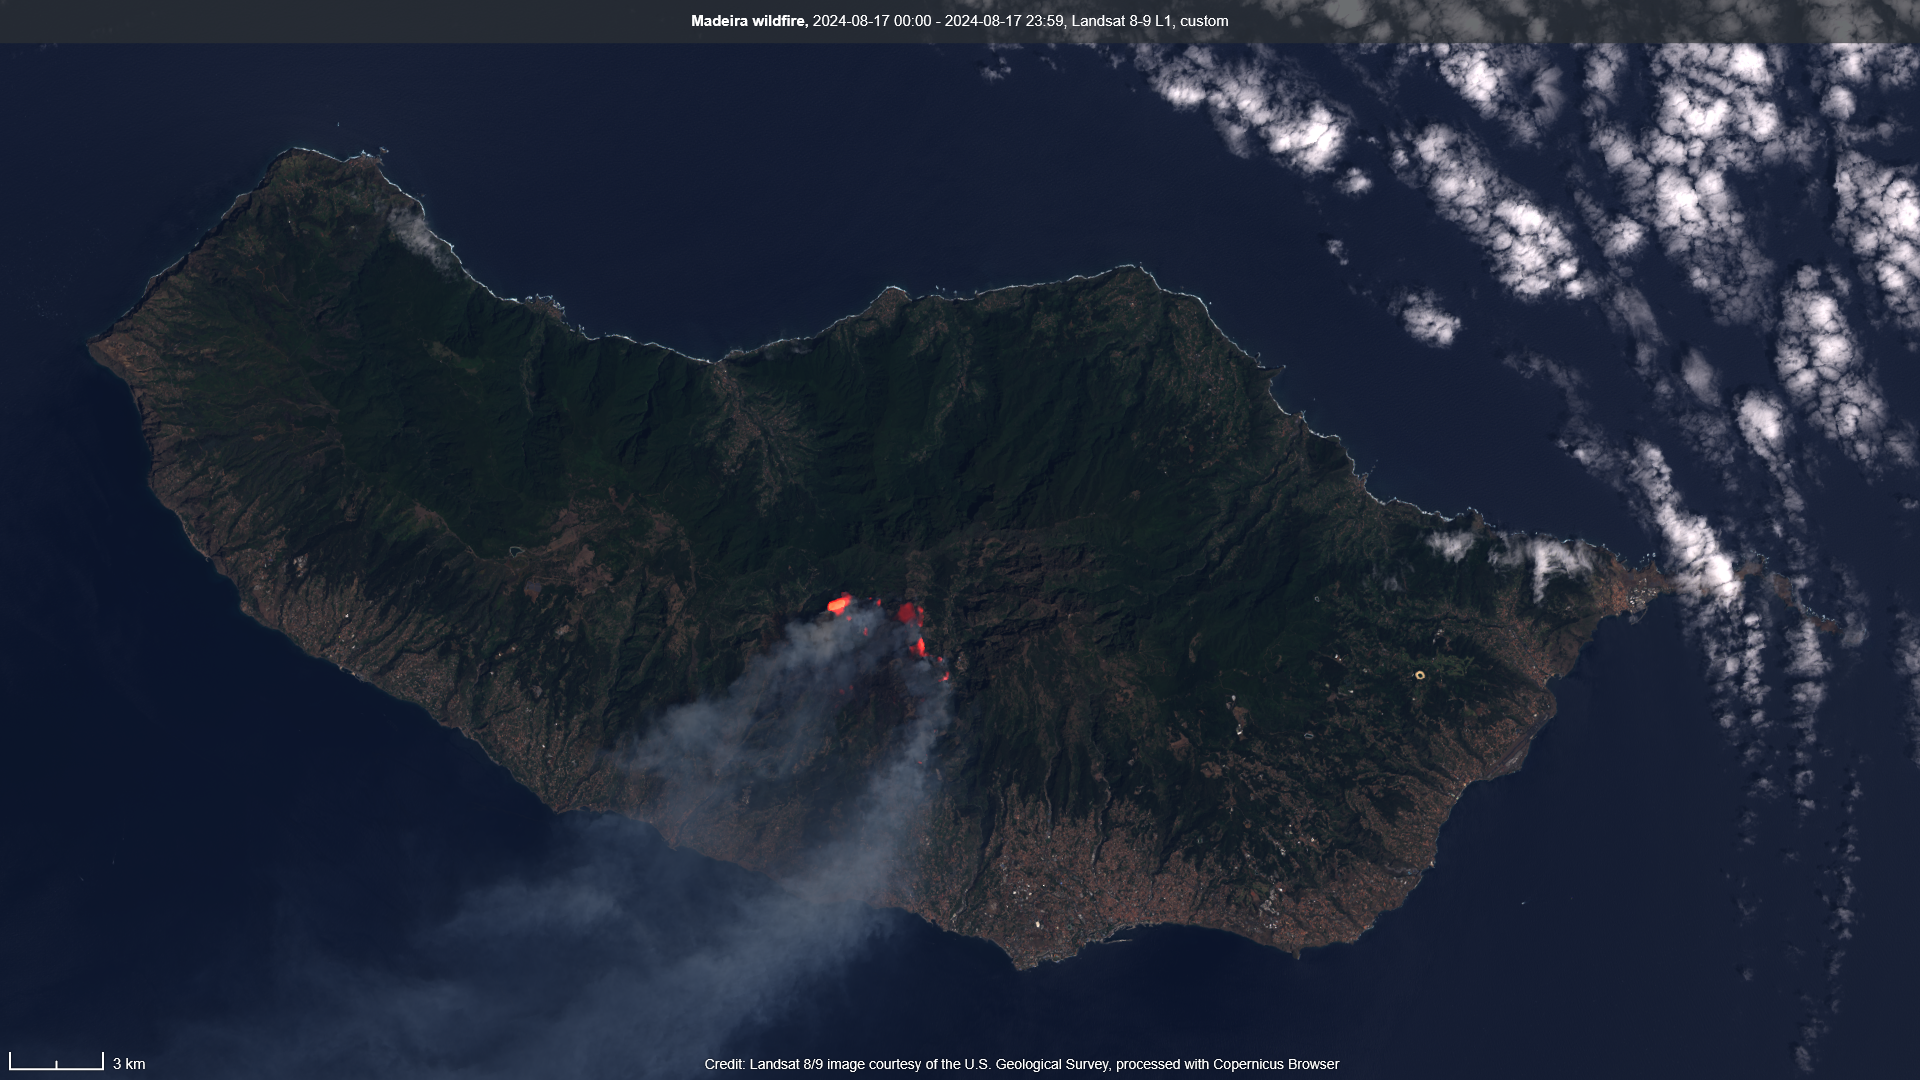
Wildfire on the island of Madeira (Portugal), acquired 2024-08-17. The active fire fronts glow red to white-hot over the darkened true-color terrain.
References
- Original Sentinel-2 visualization: Markuse fire script by Pierre Markuse
- Landsat 8 bands: Landsat 8 collection
- Custom scripts evalscript reference: Evalscript V3