Global Surface Water Extent visualisation script
//VERSION=3

//This custom script visualises the maximum water extent layer according to the data user guide.

//Set up the input and output settings.
function setup() {
  return {
    input: ["extent"],
    output: {
      bands: 3,
      sampleType: "AUTO"
    }
  };
}

//Create discrete color map
const map = [
  [0, 0xffffff],  //Not water (White)
  [1, 0x6666ff],  //Water detected (Light blue)
  [255, 0xcccccc] //No data (Light gray)
];

//Create visualizer
const visualizer = new ColorMapVisualizer(map);

//EvaluatePixel function
function evaluatePixel(sample) {
  return [visualizer.process(sample.extent)[0], visualizer.process(sample.extent)[1], visualizer.process(sample.extent)[2]];
}General description of the script
This script visualizes the Extent layer from the Global Surface Water dataset according to the official symbology (Table 1). The maximum water Extent layer combines all other layers by visualising all locations for which water presence has ever been detected over entire period.
Table 1: Extent Symbology
| Value | Symbol | Colour | Label |
|---|---|---|---|
| 0 | 0xffffff | Not water | |
| 1 | 0x6666ff | Water detected | |
| 255 | 0xcccccc | No data |
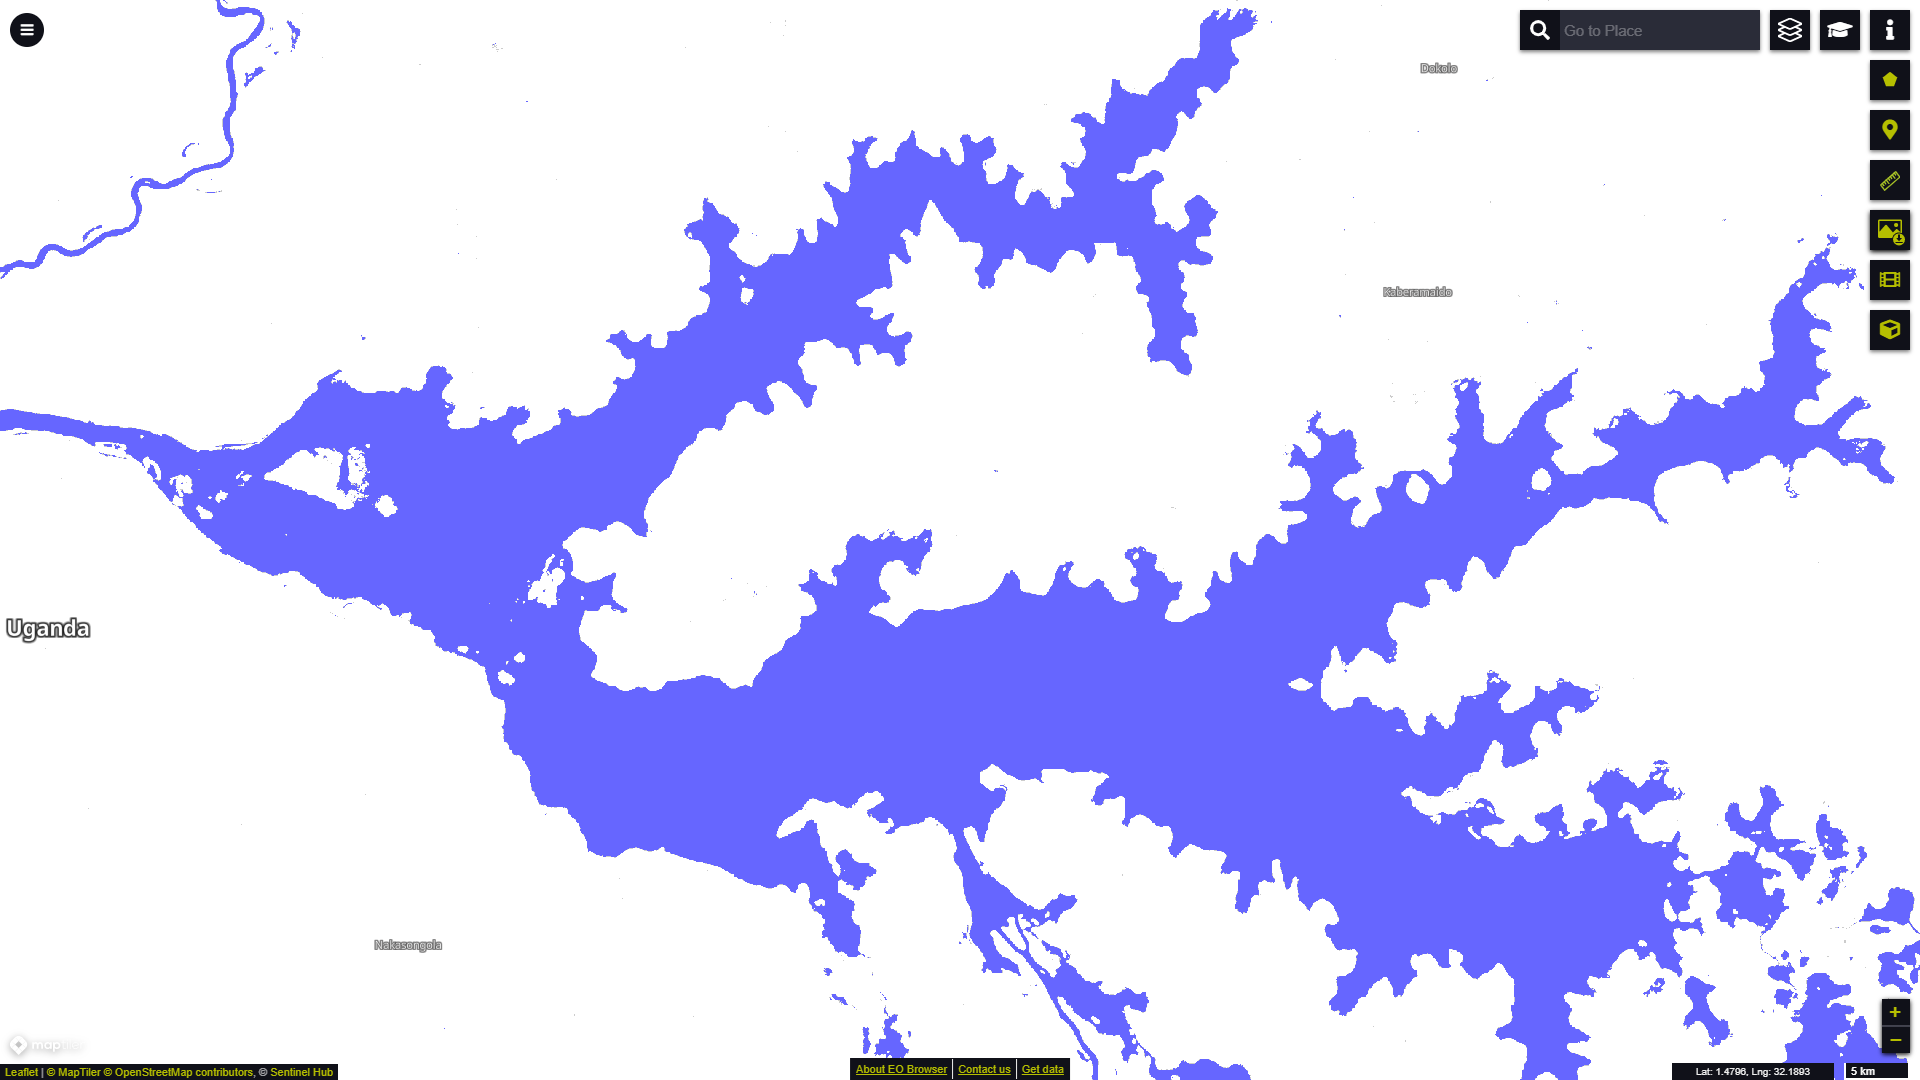
Description of representative images
Extent layer visualisation in EO Browser capturing the maximum water extent for Lake Kyoga, Uganda.