10m Annual Land Use Land Cover (9-class)
//VERSION=3

const colormap = [
  [1, 0x419bdf],
  [2, 0x397d49],
  [4, 0x7a87c6],
  [5, 0xe49635],
  [7, 0xc4281b],
  [8, 0xa59b8f],
  [9, 0xa8ebff],
  [10, 0x616161],
  [11, 0xe3e2c3]
]

const visualizer = new ColorMapVisualizer(colormap);

function evaluatePixel(samples) {
  let tile_sample = NaN;
  let tile_dataMask = 0;
  for (let i = 0; i < samples.length; i++) {
    if (samples[i].dataMask === 1) {
      tile_sample = samples[i].lulc;
      tile_dataMask = 1;
    }
  }
  let rgbVis = visualizer.process(tile_sample);
  return rgbVis.concat(tile_dataMask);
}

function setup() {
  return {
    input: [{
      bands: [
        "lulc", "dataMask"
      ]
    }],
    output: {
      bands: 4,
    },
    mosaicking: "TILE"
  }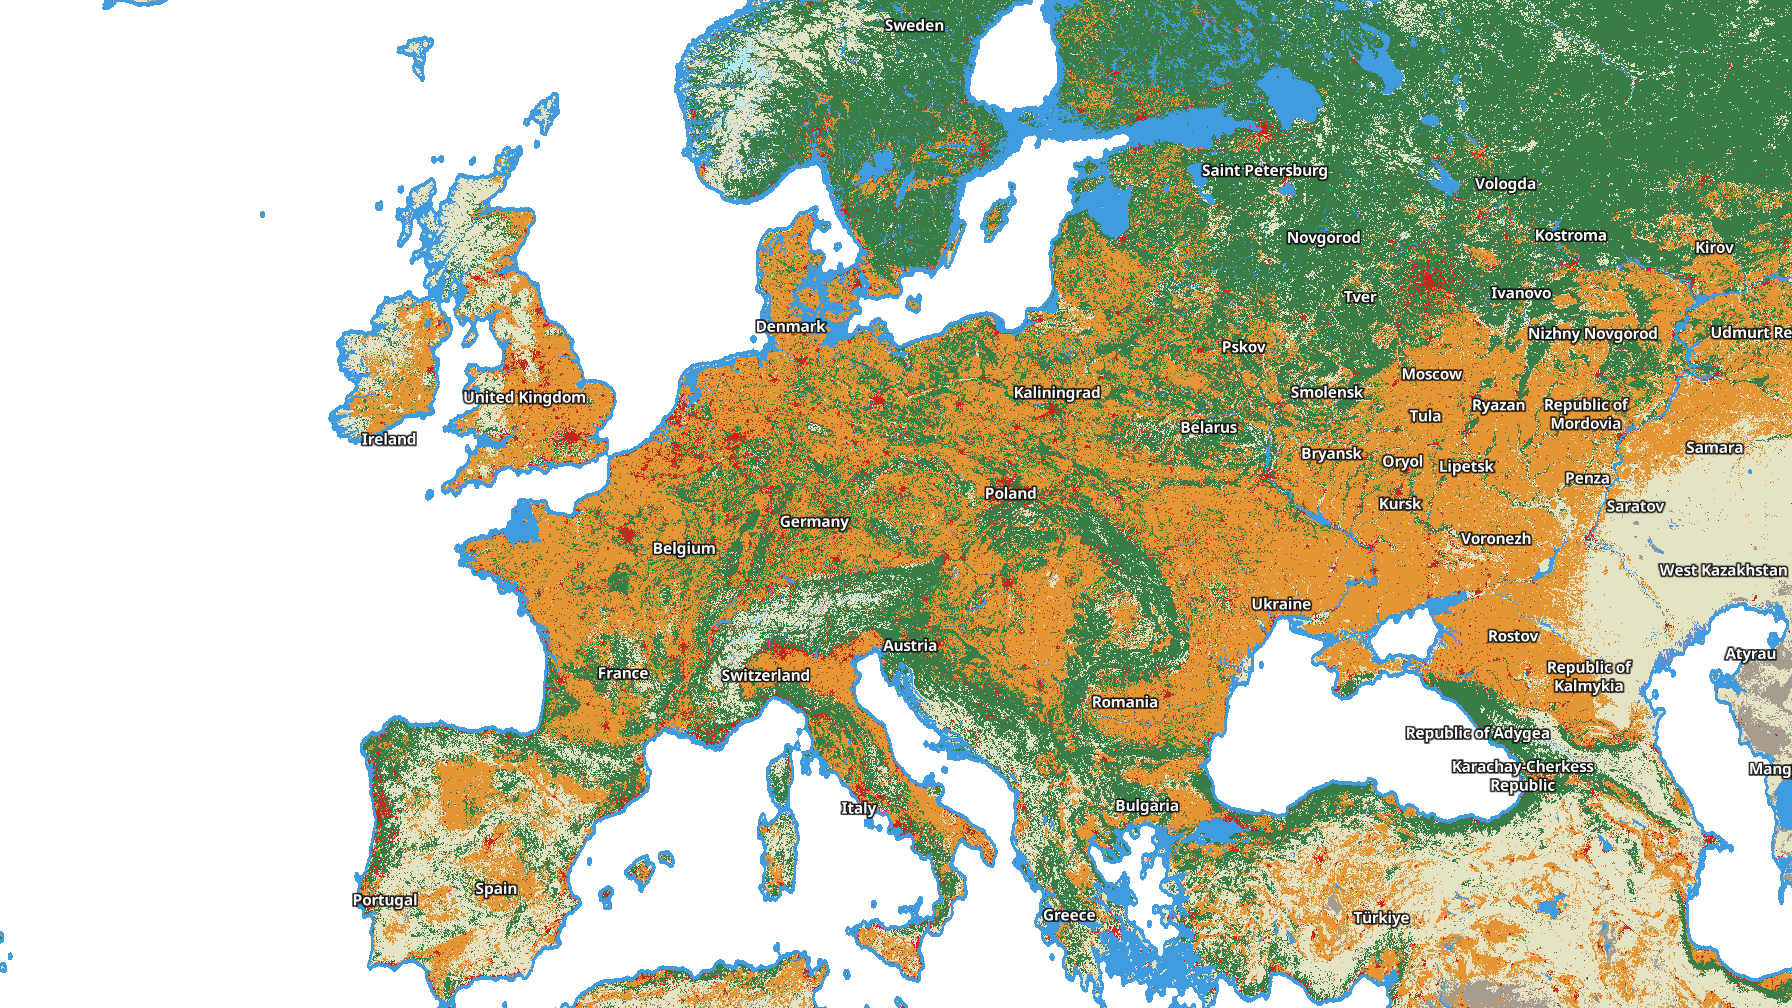
}General description of the script
This script visualises the 10m Annual Land Use Land Cover Map.
Table 1: Color legend for the 10m Annual Land Use Land Cover Map.
| Value | Color | Color Code | Class Name |
|---|---|---|---|
| 1 | 0x419bdf | Water | |
| 2 | 0x397d49 | Trees | |
| 4 | 0x7a87c6 | Flooded Vegetation | |
| 5 | 0xe49635 | Crops | |
| 7 | 0xc4281b | Built Area | |
| 8 | 0xa59b8f | Bare Ground | |
| 9 | 0xa8ebff | Snow/Ice | |
| 10 | 0x616161 | Clouds | |
| 11 | 0xe3e2c3 | Rangeland |
Description of representative images
10m Annual Land Use Land Cover 2021, Europe, visualised in EO Browser