Canopy Height, Forest Carbon Diligence
//VERSION=3
const defaultVis = true;
const max = 30;
const min = 0;

function setup() {
  return {
    input: ["CH", "dataMask"],
    output: { bands: 4, sampleTYPE: "AUTO" },
  };
}

function updateMap(max, min) {
  const numIntervals = map.length;
  const intervalLength = (max - min) / (numIntervals - 1);
  for (let i = 0; i < numIntervals; i++) {
    map[i][0] = max - intervalLength * i;
  }
}

const map = [
  [30, 0x345e03],
  [20, 0x6da20c],
  [10, 0xbace6e],
  [0, 0xf0f5d5],
];

const visualizer = new ColorRampVisualizer(map, min, max);

function evaluatePixel(sample) {
  let val = sample.CH;
  let imgVals = visualizer.process(val);

  return [...imgVals, sample.dataMask];
}
//VERSION=3
// To set custom max and min values, set
// defaultVis to false and choose your max and
// min values. The color map will then be scaled
// to those max and min values
const defaultVis = true;
const max = 30;
const min = 0;
function setup() {
return {
input: ["CH", "dataMask"],
output: [
{ id: "default", bands: 4 },
{ id: "index", bands: 1, sampleType: "UINT8" },
{ id: "eobrowserStats", bands: 1, sampleType: "FLOAT32" },
{ id: "dataMask", bands: 1 },
],
};
}
function updateMap(max, min) {
const numIntervals = map.length;
const intervalLength = (max - min) / (numIntervals - 1);
for (let i = 0; i < numIntervals; i++) {
map[i][0] = max - intervalLength * i;
}
}
const map = [
[30, 0x345e03],
[20, 0x6da20c],
[10, 0xbace6e],
[0, 0xf0f5d5],
];
const visualizer = new ColorRampVisualizer(map, min, max);
function evaluatePixel(sample) {
let val = sample.CH;
let imgVals = visualizer.process(val);
return {
default: imgVals.concat(sample.dataMask),
index: [val],
eobrowserStats: [val],
dataMask: [sample.dataMask],
};
}//VERSION=3
function setup() {
return {
input: ["CH"],
output: { bands: 1, sampleType: "UINT8" },
};
}
function evaluatePixel(sample) {
return [sample.CH]
}Evaluate and visualize
As Forest Carbon Diligence is commercial data, brought into Sentinel Hub as Bring Your Own Data, direct EO Browser links are not possible due to the personalized data credentials.
General description
Canopy height quantifies the average stand height of trees within each pixel. Because this is a spatial average over a moderate resolution, the modeled height values are shorter than the tallest individual tree within a pixel.
The data layer has four bands:
- Canopy Height quantifies the average height of all vegetation in that pixel.
- Lower prediction bound (5th percentile) of the 90% prediction interval for model predictions at each pixel.
- Upper prediction bound (95th percentile) of the 90% prediction interval for model predictions at each pixel.
- Quality Assurance Flags describing the expected quality of satellite data measurements, and whether any temporal gap-filling was applied.
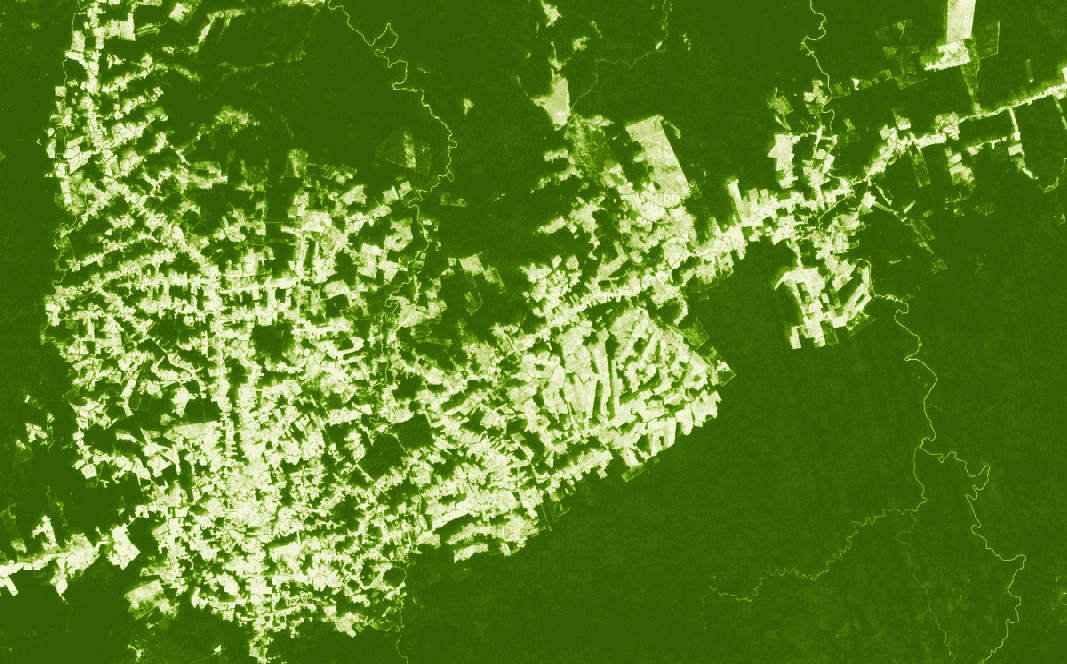
Description of representative images
Canopy Height in 2022 near Apui, Brazil.