PUCK - Perceptually-Uniform Color Map Kit Script
//VERSION=3


/*
Perceptually-Uniform Colormap Kit
author: Keenan Ganz (ganzk@rpi.edu)
September 2020
*/

/*
Reference white values for D65 illuminant,
secondary observer.
*/
var REF_X = 95.0489
var REF_Y = 100.0
var REF_Z = 108.8840

function percent_between(min, max, x){
  return (x - min) / (max - min)
}

function clip(min, max, x) {
  return Math.min(max, Math.max(min, x))
}

function rgb2lab(rgb) {
  /*
  Convert rgb coordinates to CIELAB coordinates via XYZ.
  Expects normalized RGB values.

  Arithmetic from easyrgb.com
  */
  let [r, g, b] = rgb

  function to_linear(val) {
    if (val > 0.04045)
      return Math.pow((val + 0.055) / 1.055, 2.4)
    else
      return val / 12.92
  }

  let r_lin = to_linear(r) * 100
  let g_lin = to_linear(g) * 100
  let b_lin = to_linear(b) * 100

  let x = r_lin * 0.4124 + g_lin * 0.3576 + b_lin * 0.1805
  let y = r_lin * 0.2126 + g_lin * 0.7152 + b_lin * 0.0722
  let z = r_lin * 0.0193 + g_lin * 0.1192 + b_lin * 0.9505

  let x_std = x / REF_X
  let y_std = y / REF_Y
  let z_std = z / REF_Z

  function std_prep(val) {
    if (val > 0.008856)
      return Math.pow(val, 1.0 / 3.0)
    else
      return val * 7.787 + (16.0 / 116.0)
  }
  let L = 116.0 * (std_prep(y_std) - 16.0 / 116.0)
  let a = 500.0 * (std_prep(x_std) - std_prep(y_std))
  b = 200.0 * (std_prep(y_std) - std_prep(z_std))

  return [L, a, b]
}

function lab2rgb(Lab) {
  /*
  Convert CIELAB coordinates to RGB coordinates.

  Arithmetic from easyrgb.com
  */
  let [L, a, b] = Lab
  let var_y = (L + 16.0) / 116.0
  let var_x = (a / 500.0) + var_y
  let var_z = var_y - (b / 200.0)

  function undo_std_prep(val) {
    if (Math.pow(val, 3.0) > 0.008856)
      return Math.pow(val, 3.0)
    else
      return (val - (16.0 / 116.0)) / 7.787
  }
  var_y = undo_std_prep(var_y)
  var_x = undo_std_prep(var_x)
  var_z = undo_std_prep(var_z)

  let x = var_x * REF_X / 100
  let y = var_y * REF_Y / 100
  let z = var_z * REF_Z / 100

  let var_r = x * 3.2406 + y * -1.5372 + z * -0.4986
  let var_g = x * -0.9689 + y * 1.8758 + z * 0.0415
  let var_b = x * 0.0557 + y * -0.2040 + z * 1.0570

  function undo_linear(val) {
    if (val > 0.0031308)
      return 1.055 * Math.pow(val, (1.0 / 2.4)) - 0.055
    else
      return val * 12.92
  }

  let r = Math.max(undo_linear(var_r), 0)
  let g = Math.max(undo_linear(var_g), 0)
  b = Math.max(undo_linear(var_b), 0)

  // mapping isn't perfect, constrain to [0, 1]

  return [clip(0, 1, r), clip(0, 1, g), clip(0, 1, b)]
}

class Colormap {
  /*
  Base class for making perceptually uniform color maps. Using this class on its own
  simply maps RGB coordinates to LAB space and linearly interpolates inbetween values.

  Use SequentialColorMap, DivergentColorMap, etc. for more specific use cases.
  */
  constructor(color_anchors, data_anchors, remap=true, uniform=false) {
    if (color_anchors.length < 1)
      throw "ColorMap requires at least one color."
    if (color_anchors.length != data_anchors.length)
      throw "Color and data anchors must be of same length."
    // verify that the data array is sorted low to high

    for (let i = 1; i < data_anchors.length; i++) {
      if (data_anchors[i] < data_anchors[i - 1])
        throw "Data anchors array must be sorted."
    }
    // map incoming rgb coordinates into LAB space

    this.data_anchors = data_anchors
    if (remap) this.color_anchors = color_anchors.map(rgb2lab)
    else this.color_anchors = color_anchors
    // do the lightness correction, if desired, and then check

    // if the correction moved colors outside of RGB space

    if (uniform) { this._lightness_correction() }
  }

  _lightness_correction() {return}

  get_color(data_value) {
    // return edge values if data value is oob

    if (data_value <= this.data_anchors[0])
      return lab2rgb(this.color_anchors[0])
    else if (data_value >= this.data_anchors[this.data_anchors.length - 1])
      return lab2rgb(this.color_anchors[this.color_anchors.length-1])

    return lab2rgb(colorBlend(data_value, this.data_anchors, this.color_anchors))
  }
}

class LinearColormap extends Colormap {
  /*
  Simple linear ramp color map class. Set uniform to true
  in the constructor to enforce constant lightness.
  */
  constructor(color_anchors, data_anchors, uniform=true) {
    super(color_anchors, data_anchors, true, uniform)
  }

  _lightness_correction() {
    // get overall change in lightness

    let L0 = this.color_anchors[0][0]
    let Lp = this.color_anchors[this.color_anchors.length-1][0]
    let dL = Lp - L0

    // make the lightness values monotonically change

    for (let i = 1; i < this.color_anchors.length - 1; i++) {
      let percent_interval = percent_between(
        this.data_anchors[this.data_anchors.length - 1],
        this.data_anchors[0],
        this.data_anchors[i]
      )
      this.color_anchors[i][0] = L0 + (dL * percent_interval)
    }
  }
};

class DivergentColormap extends Colormap {
  /*
  Color map that reaches a max/min lightness at its center and changes
  monotonically toward the edges of the data with equal lightness
  at each edge. If you don't want the lightness correction, just use
  LinearColormap with uniform=false.
  */
  constructor(color_anchors, data_anchors) {
    if (color_anchors.length % 2 != 1)
      throw "DivergentColorMap must have an odd number of anchors."
    super(color_anchors, data_anchors, true, true)
  }

  _lightness_correction() {
    // L0 is the mean lightness of the edge colors

    // Lp is the lightness of the center color

    let len = this.color_anchors.length
    let L0 = (this.color_anchors[0][0] + this.color_anchors[len - 1][0]) / 2
    // set the edge colors lightness to the mean

    this.color_anchors[len - 1][0] = this.color_anchors[0][0] = L0

    // Calculate intermediate lightness values

    let Lp = this.color_anchors[Math.floor(len / 2)][0]
    let dL = Lp - L0

    for (let i = 1; i < Math.floor(len / 2); i++) {
      let left_percent_interval = percent_between(
        this.data_anchors[Math.floor(len / 2)],
        this.data_anchors[0],
        this.data_anchors[i]
      )
      // Invert right % since lightness trends the other way now

      let right_percent_interval = 1 - percent_between(
        this.data_anchors[len - 1],
        this.data_anchors[Math.floor(len / 2)],
        this.data_anchors[len - 1 - i]
      )
      this.color_anchors[i][0] = L0 + (dL * left_percent_interval)
      this.color_anchors[len - 1 - i][0] = L0 + (dL * right_percent_interval)
    }
  }
}

class IsoluminantColormap extends Colormap {
  /*
  Color map that enforces constant lightness. Not particularly pretty on its own,
  but can be overlaid on relief shading to visualize data on top of topography.
  */
  constructor(color_anchors, data_anchors) {
    super(color_anchors, data_anchors, true, true)
  }
  _lightness_correction() {
    // get the mean lightness of all colors

    let L_sum = 0
    for (let i = 0; i < this.color_anchors.length; i++) {
      L_sum += this.color_anchors[i][0]
    }
    let L_avg = L_sum / this.color_anchors.length

    // set all anchors to have lightness of this value

    for (let i = 0; i < this.color_anchors.length; i++) {
      this.color_anchors[i][0] = L_avg
    }
  }
}

/*
Example usage: Masked NDVI on a white-green
color map.
*/

var map = [
  [217/255, 229/255, 206/255],
  [12/255, 22/255, 3/255],
]

var data = [-0.1, 1]

var cmap = new LinearColormap(map, data);

function setup() {
  return {
    input: ["B02", "B03", "B04", "B08", "dataMask"],
    output: {
      bands: 3
    }
  };
}

function trueColor(sample){
  return [sample.B04 * 2.5, sample.B03 * 2.5, sample.B02 * 2.5]
}

function evaluatePixel(sample) {
  let ndvi = (sample.B08 - sample.B04) / (sample.B04 + sample.B08)
  if (ndvi > -.1) {return cmap.get_color(ndvi)}
  else {return trueColor(sample)}
}Evaluate and Visualize
General description of the script
A set of visualization utilities that produce beautiful images designed for human perception from single-channel data (NDVI, spectral angle, etc). Generate quality figures that are true to the data.
Good visualizations depend on good color maps. However, it is very easy to unintentionally create data artifacts or obscure trends unless care is taken. For example, many have written about the problems with rainbow color maps (e.g. Borland and Taylor 2007 and Kovesi 2015, see references). Yet, rainbows remain prevalent in scientific publications (and occasionally on SentinelHub).
SentinelHub custom scripts have limited support for custom color maps: colorBlend and ColorRampVisualizer. As a result, many users end up hardcoding their colors. Also, these functions use RGB colors instead of a color gamut designed around human perception. The goal of this project is to create tools for custom script developers to generate useful and perceptually uniform color maps. It provides visualization classes for users familiar with CIELAB color space and works to correct colors in RGB space to be perceptually uniform. The underlying mathematics is used by many scientific plotting applications, such as matplotlib, bokeh, chroma.js, and others.
Details of the script
How the Script Works
This script supports 4 flavors of color map in addition to functions that inter-convert between the CIELAB, XYZ, and RGB color spaces in pure JavaScript. In each case, the user simply provides two arrays, one for anchor colors and one for data values, and the class will generate the correct color for data values calculated by the script. For example, to generate a brown-green color map for NDVI values in the range [0, 1], simply use:
var ndvi_map = [ // https://www.google.com/search?q=rgb+color+picker [66/255, 50/255, 28/255], [0, 209/255, 3/255], ] var data = [0, 1] var cmap = new LinearColormap(ndvi_map, data);
function setup() { return { input: [“B04”, “B08”, “dataMask”], output: { bands: 3 } } }
function evaluatePixel(sample) { let ndvi = (sample.B08 - sample.B04) / (sample.B08 + sample.B04) return cmap.get_color(ndvi) }
In addition to LinearColormap, there is DivergentColormap, IsoluminantColormap, and the base class Colormap. The base class expects colors in CIELAB color space and simply calls colorBlend to get in-between colors before converting back to RGB space. All other classes expect colors in RGB space, map them onto CIELAB space, and apply a lightness correction specific to the class. The corrections for each class are:
- LinearColormap: Lightness monotonically changes across the whole map. Your standard color ramp.
- DivergentColormap: Lightness reaches a minimum or maximum at the center of the color map and monotonically changes towards the edges of the map. Each edge has the same lightness. Useful for showing how values are distributed around a reference value. However, problems can arise if data features straddle the lightness peak.
- IsoluminantColormap: Lightness is the same across the whole map. Not very pretty on its own, but useful when one wants to visualize data on top of relief shading.
Applicability
This script is useful for any continuous, single-channel data product.
Known Issues
The script is a visualization utility, so false detection issues are not applicable. However, since by definition not all combinations of CIELAB coordinates map onto valid RGB values, the lightness correction may be invalidated by especially poor RGB anchors. For this reason, it is usually best to implement an already-proven color map instead of implementing one from scratch. Also, having too many lines of code can break link sharing. To share your code with others, delete the classes you are not using so the code fits in a URL.
Color Spaces
RGB color space is defined in terms of the relative brightness of red, green, and blue color used in screens. XYZ color space was specified by the International Commission on Illumination in 1931 following a series of perception experiments with human observers (Smith and Guild 1931). CIELAB color space is the successor to XYZ space, defined in 1976 with the goal of being more perceptually uniform (Judd, CIE Publication No. 015). CIELAB, also known as Lab, is defined by three parameters: lightness (L), red-green (a), and blue-yellow (b). Conversion directly to and from RGB and CIELAB space in one step is generally not used. The script converts from RGB to XYZ and then to CIELAB using a D65, secondary-observer reference white. Mathematics of the conversion are available in pseudocode here.
Color Maps
Issues with color maps generally stem from the fact that humans perceive differences in color lightness better than differences in color hue or saturation (Cleveland and McGill 1984). In addition, the colors used in a map should have intuitive meaning. Returning to Roy G. Biv, do you instantly understand yellow-green to be between orange and violet? Is it closer to orange or violet? For most people, the relationship is difficult to understand quantitatively.
To make your own color maps there are many battle-tested maps available at SciVisColor. If the distribution of data is unknown, it is best to use a perceptually-uniform color map with a strong overall lightness gradient. SciVisColor recommends a blue-orange divergent map for general use.
Author of the script
Keenan Ganz
Description of representative images
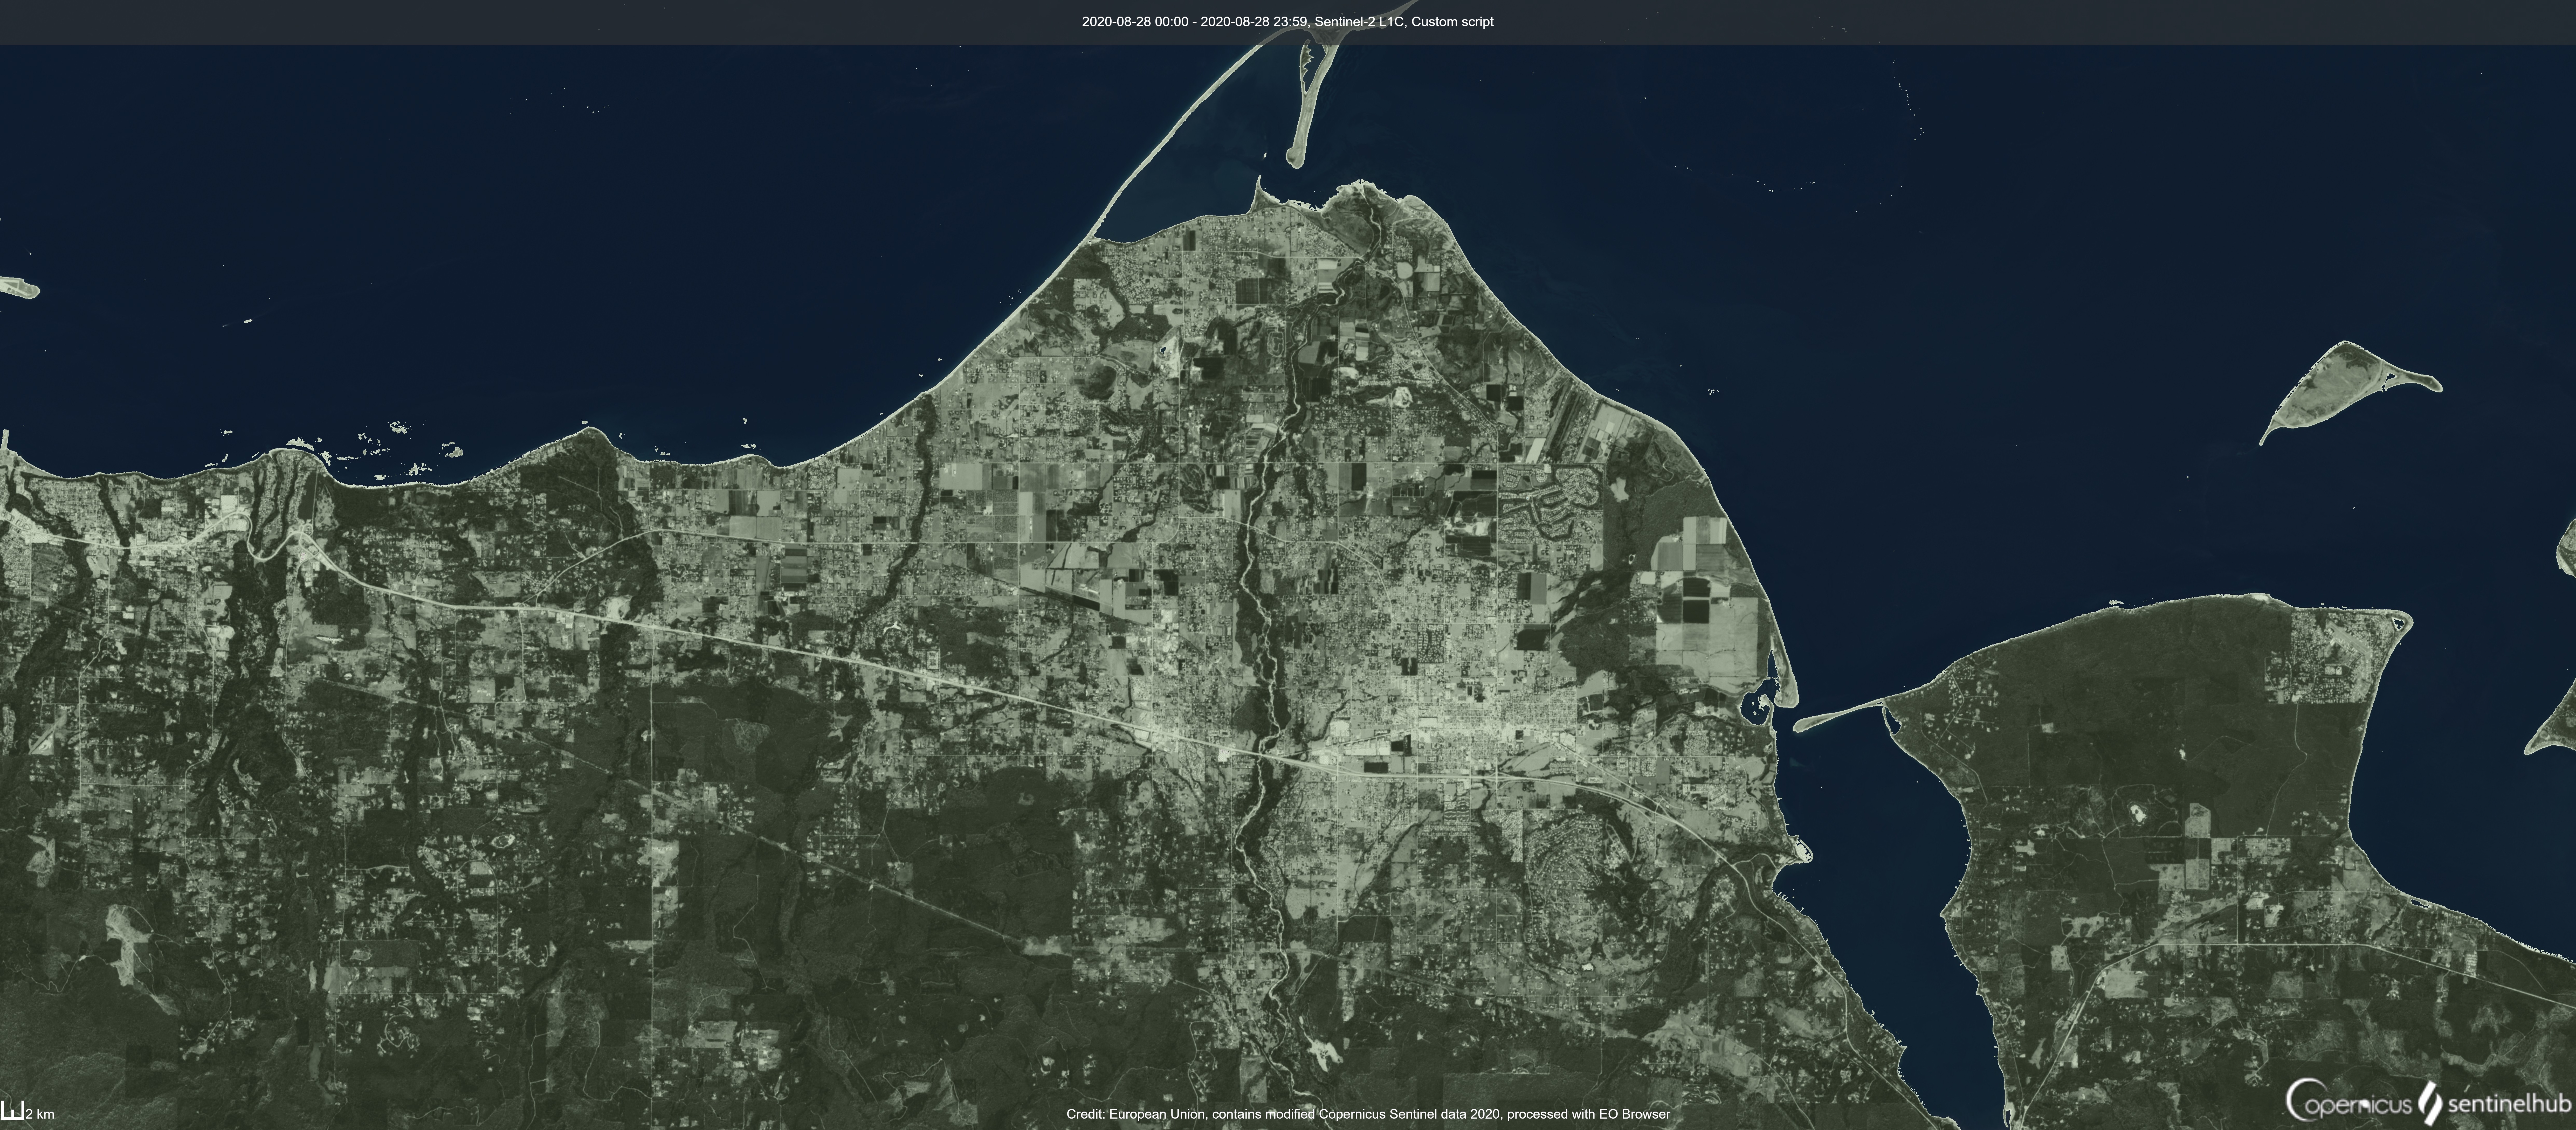
- Masked NDVI over Sequim, Washington, USA using a white-green Linear Colormap. The town of Sequim has low NDVI values, while Olympic National Park to the south has very dense vegetation.

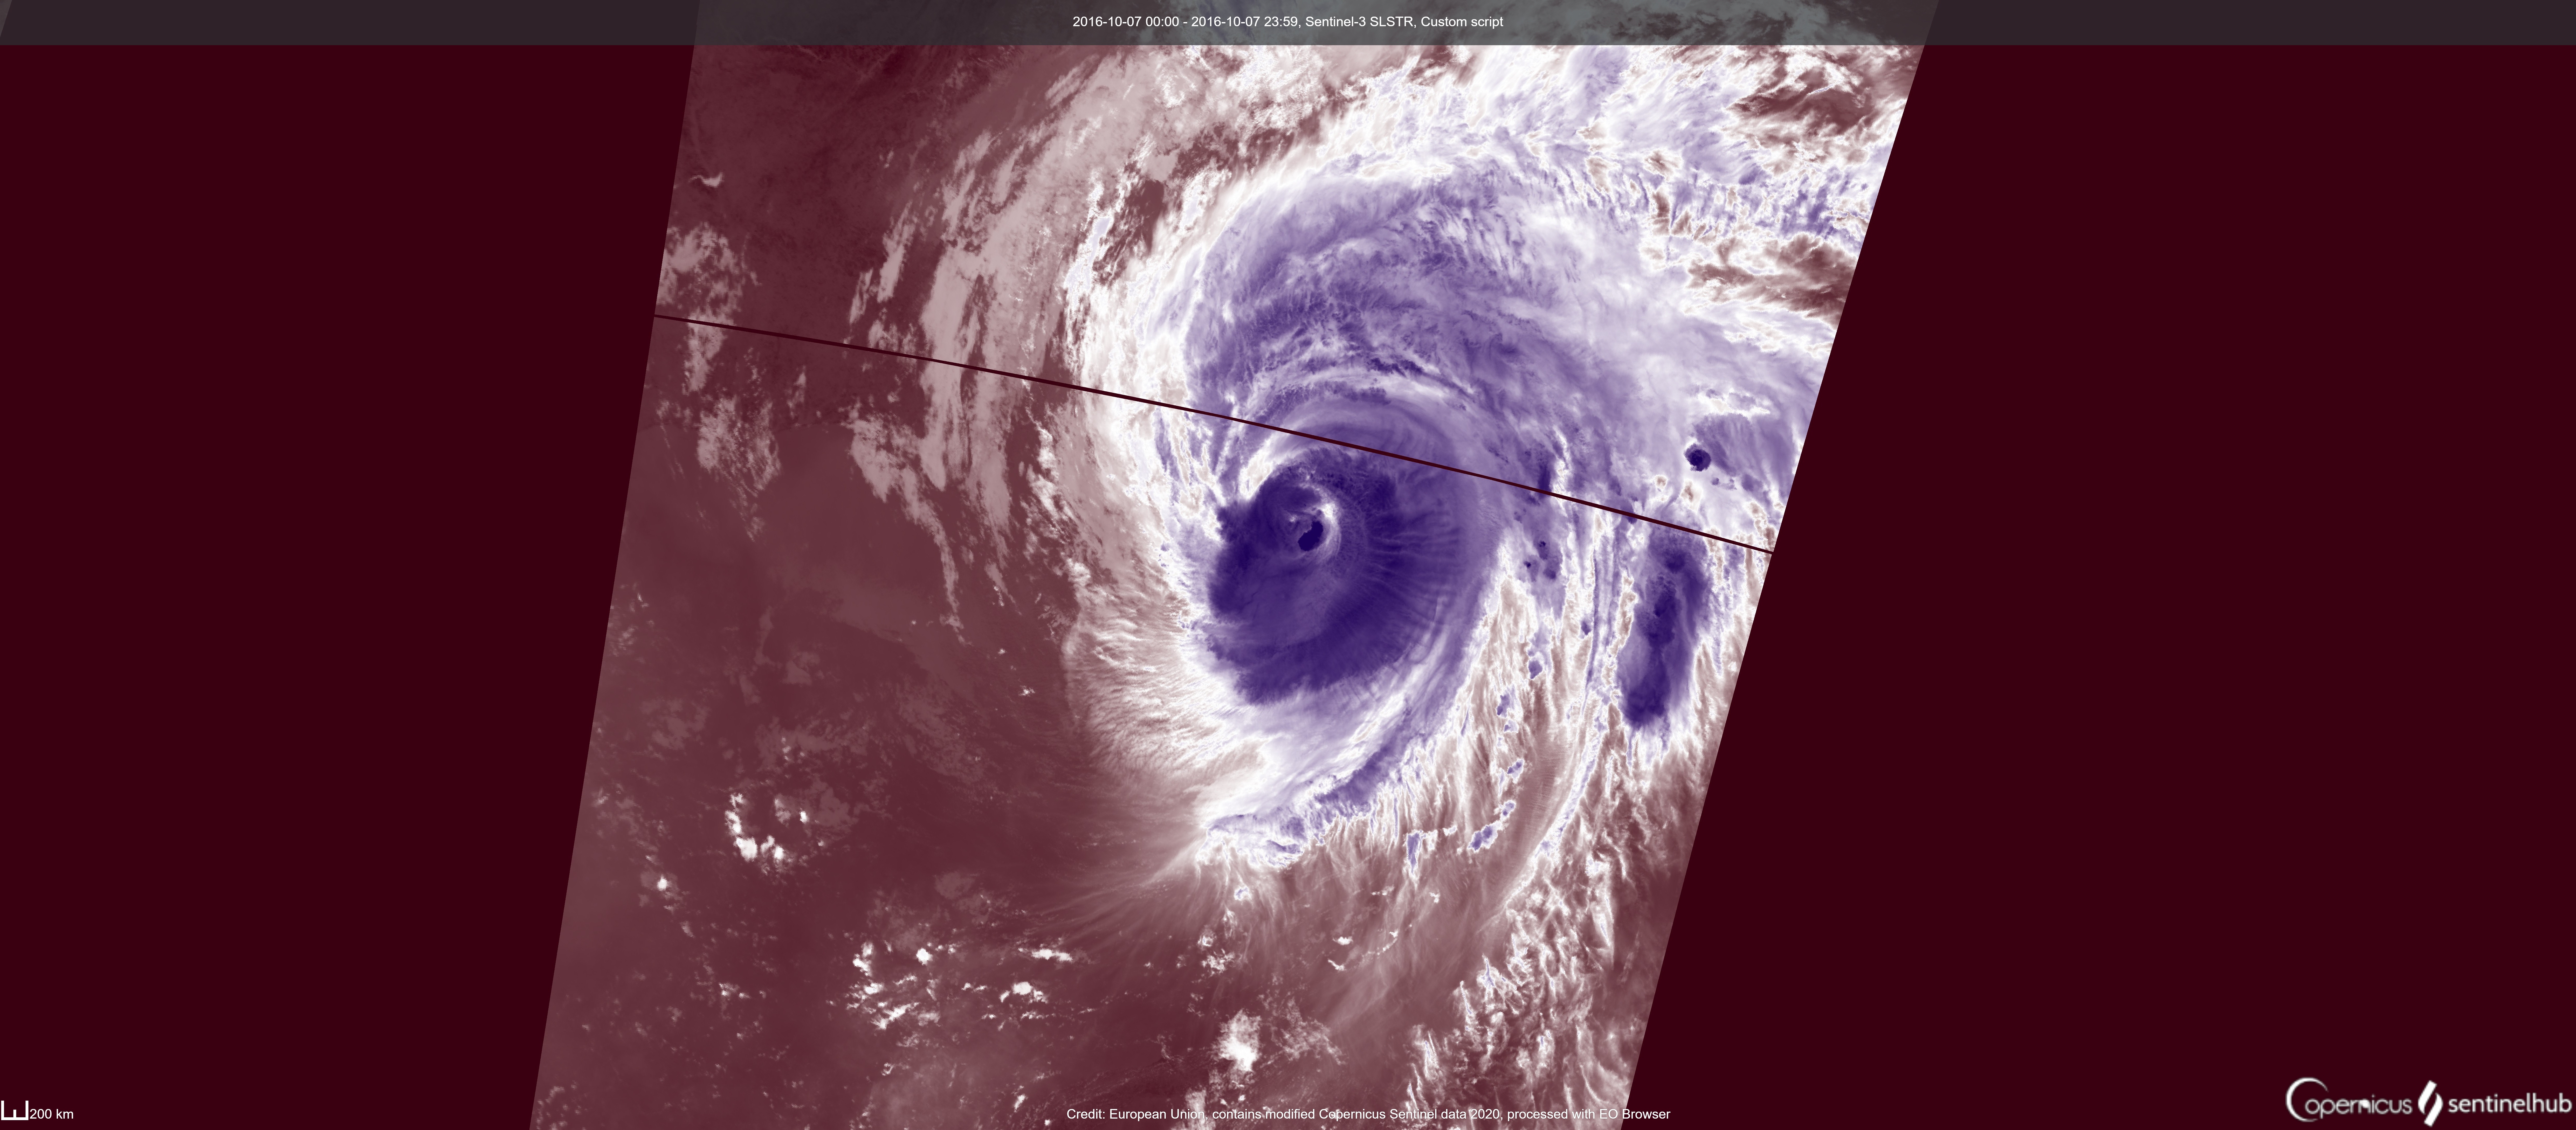
- Hurricane Matthew brightness temperature visualized with a blue-white-red Divergent Colormap. Range is 200-300 K.

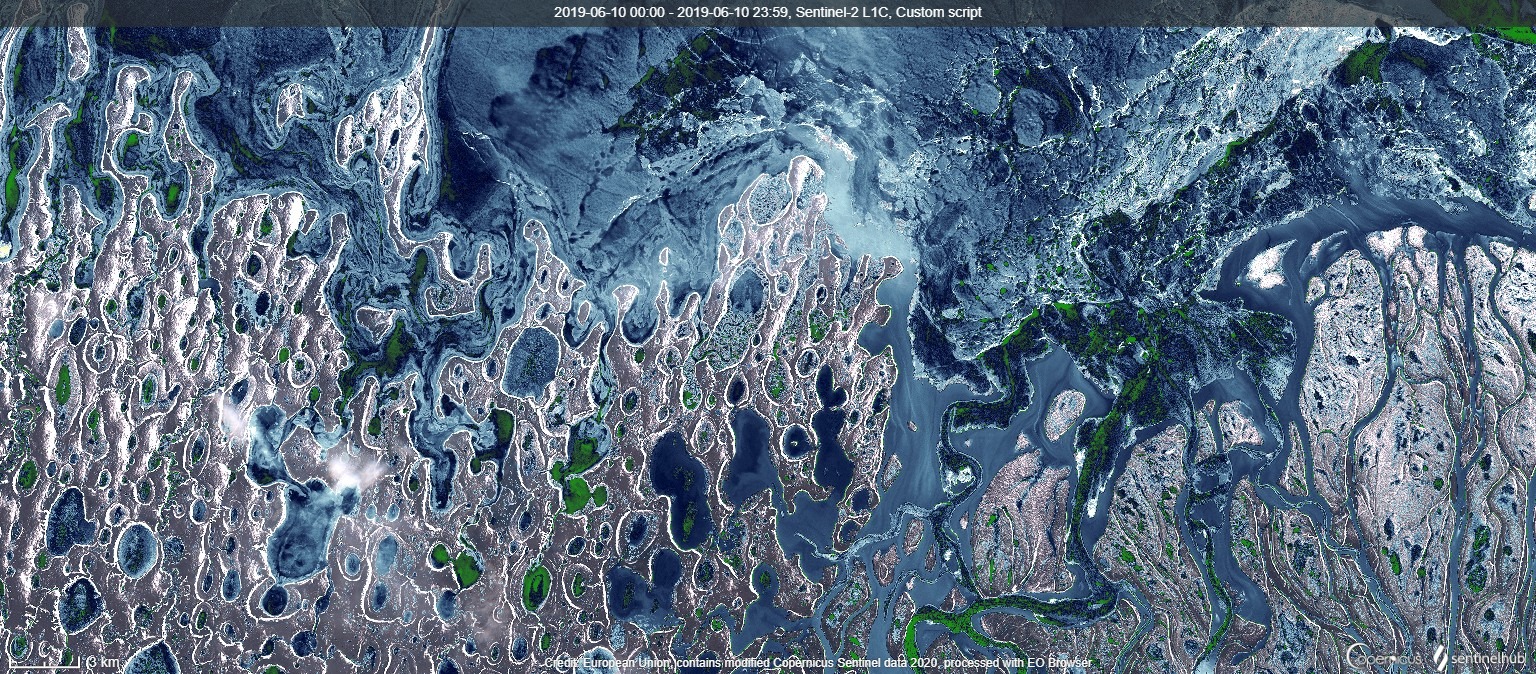
- Masked NDWI over the Lena River delta using a custom two-wave color map; white-blue-black-green. Lightness correction is not used here to allow for rise/fall. Custom data breaks show extent of detail in the data.

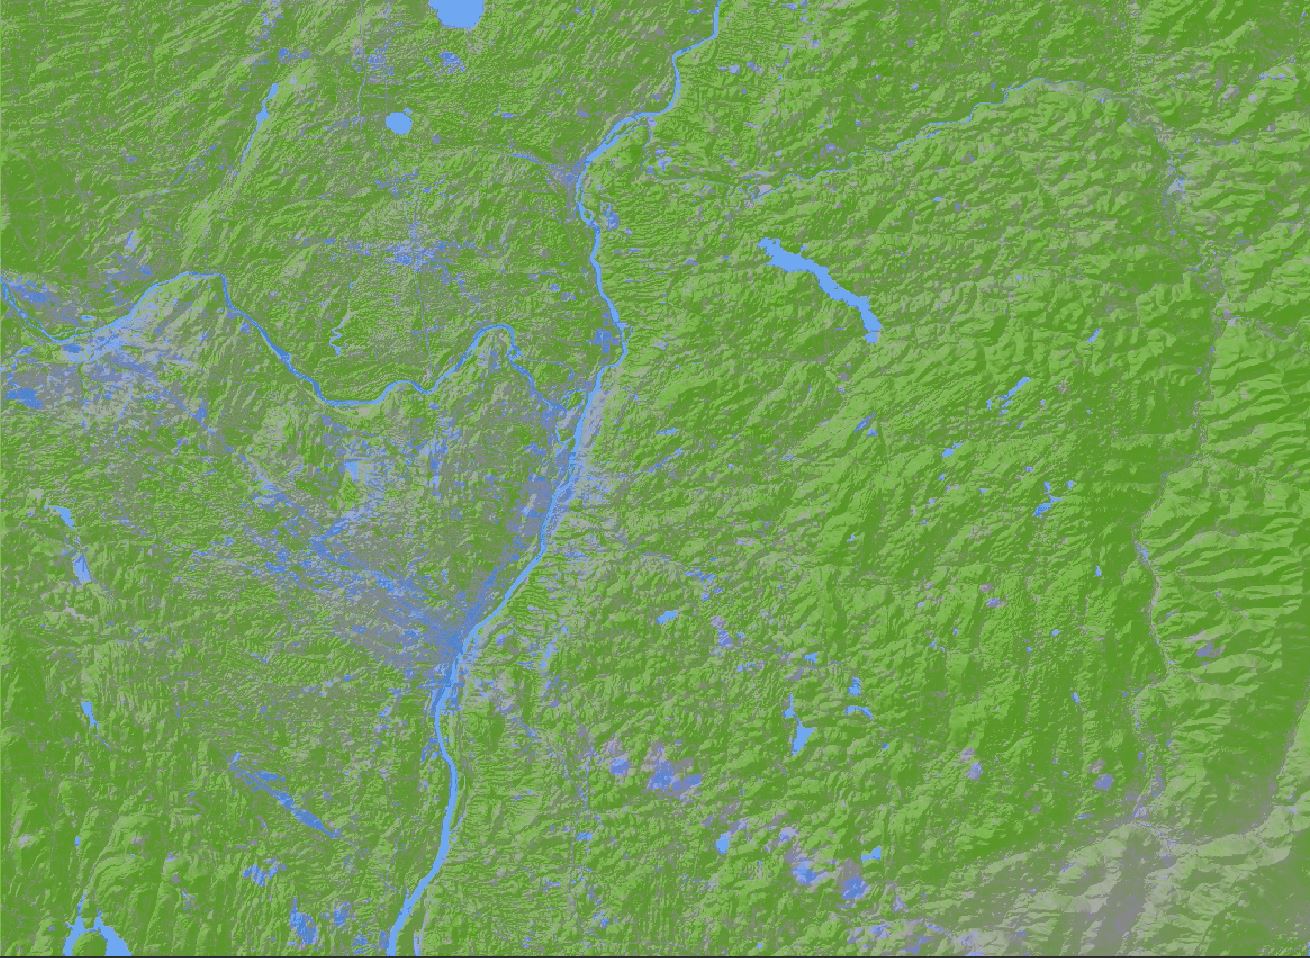
- Isoluminant NDVI over Troy, New York, USA overlaid with relief shading. Note that interpretation of terrain features is unhindered by NDVI data.

References
Not used specifically for defining color mapping, but useful reading for designing color maps:
[1] OíDonoghue, Se·n I., et al. ìVisualization of Biomedical Data.î Annual Review of Biomedical Data Science, vol. 1, no. 1, 2018, pp. 275ñ304. Annual Reviews, doi:10.1146/annurev-biodatasci-080917-013424.
[2] Moreland, Kenneth. ìWhy We Use Bad Color Maps and What You Can Do About It.î Electronic Imaging, vol. 2016, no. 16, Feb. 2016, pp. 1ñ6. IngentaConnect, doi:10.2352/ISSN.2470-1173.2016.16.HVEI-133.
| [3] Mason, Betsy. ìWhy Scientists Need to Be Better at Data Visualization.î Knowable Magazine | Annual Reviews, Annual Reviews, Nov. 2019. www.knowablemagazine.org, doi:10.1146/knowable-110919-1. |
Credits
Borland, David, and M. Russell Taylor. ìRainbow Color Map (Still) Considered Harmful.î IEEE Computer Graphics and Applications, vol. 27, no. 2, Apr. 2007, pp. 14ñ17. PubMed, doi:10.1109/mcg.2007.323435.
CIE Publication No. 015: Colorimetry. Central Bureau of the CIE, Vienna (2004)
Cleveland, William S., and McGill, Robert. ìGraphical Perception: Theory, Experimentation, and Application to the Development of Graphical Methods.î Journal of the American Statistical Association, vol. 79, no. 387, [American Statistical Association, Taylor & Francis, Ltd.], 1984, pp. 531ñ54. JSTOR, JSTOR, doi:10.2307/2288400.
Judd, Deane B., et al. ìSpectral Distribution of Typical Daylight as a Function of Correlated Color Temperature.î JOSA, vol. 54, no. 8, Optical Society of America, Aug. 1964, pp. 1031ñ40. www.osapublishing.org, doi:10.1364/JOSA.54.001031.
Kovesi, Peter. ìGood Colour Maps: How to Design Them.î ArXiv:1509.03700 [Cs], Sept. 2015. arXiv.org, https://arxiv.org/abs/1509.03700.
Smith, T., and J. Guild. ìThe C.I.E. Colorimetric Standards and Their Use.î Transactions of the Optical Society, vol. 33, no. 3, IOP Publishing, Jan. 1931, pp. 73ñ134. Institute of Physics, doi:10.1088/1475-4878/33/3/301.