Mangrove Radar script
//VERSION=3
// Mangrove Radar Index by András Zlinszky, Sinergise Solutions
// enables color palette visualization of Sentinel-1 VV backscatter
// Mangrove often has a slightly higher reflectivity in Sentinel-1 VV than other vegetation. You can tune palette min and max values and individual color thresholds to find mangrove.
// Note that other vegetation (eg banana plantations) and other land cover classes (eg cities) may also reflect strongly in VV, so the visualization is not selective for mangrove.

// set constants for the color map minimum and maximum here. These will override the values in the colormap variable, with the individual color steps scaling proportionally to their value, within the interval set by the min and max.
const max = 0.87;
const min = -0.05;


// adding input data bands, defining outputs
function setup() {
  return {
    input: ["VV", "dataMask"],
    output: [
      { id: "default", bands: 4 },
      { id: "eobrowserStats", bands: 1 },
      { id: "dataMask", bands: 1 },
      { id: "index", bands: 1, sampleType: "FLOAT32" },
    ],
  };
}

//defining the color map https://documentation.dataspace.copernicus.eu/APIs/SentinelHub/Evalscript/Functions.html#colormapvisualizer

const map = [
  [0.9, 0xf7eafd], //very light lavender
  [0.73, 0xebebeb], //very light grey
  [0.7, 0xa76b18], //brown ochre
  [0.65, 0xdca620], //golden yellow
  [0.6, 0xA2AE32], //olive green
  [0.4, 0x18a722], //bright green
  [0.3, 0x018643], //deep green
  [0.2, 0x15965], //teal green
  [0.1, 0x01471c], //very dark green
  [0.075, 0x0d5854], //dark turquoise
  [0.05, 0x7102c], //blue
  [0.04, 0x0d027e], //dark blue
  [0.01, 0x08014c], //very dark blue
  [0.005, 0x4a4a4a], //dark grey
];

const visualizer = new ColorRampVisualizer(map, min, max);

function evaluatePixel(samples) {
  const value = Math.max(0, Math.log(samples.VV) * 0.21714724095 + 1);
  const imgVals = visualizer.process(value)
  return {
    default: [...imgVals, samples.dataMask],
    eobrowserStats: [value],
    dataMask: [samples.dataMask],
    index: [value],
  };
}
// This section is copied from the regular Sentinel-1 mosaics VV decibel gamma evalscript
// ---
/*
  // displays VV in decibels from -20 to 0
  // the following is simplified below
  // var log = 10 * Math.log(VV) / Math.LN10;
  // var val = Math.max(0, (log + 20) / 20);

  return [Math.max(0, Math.log(VV) * 0.21714724095 + 1)];
*/Evaluate and Visualize
General description of the script
Mangrove vegetation is essential for shore protection, carbon sequestration and the maintenance of biodiversity and human livelyhoods. Tracking changes in mangrove with satellite imagery can be particularly difficult due to frequent cloud cover. Here we exploit the regular and consistent radar data provided by Sentinel-1 monthly mosaics as a source for mangrove monitoring. It seems from empirical observation that depending on the season, mangrove vegetation can have a slightly higher reflectivity in VV polarization than many other vegetation types. Therefore, by visualizing VV decibel gamma0 on a colour ramp, it is possible to create a color scheme where potential mangrove vegetation stands out. Of course, this visualization can also be used as a generic tool for understanding radar reflectivity of various surface types. We chose a color ramp similar to the atlas shader that is regularly used to visualize elevation - therefore it is easy to understand where high and low reflectivity is observed (and the sea is more or less blue)
How to use
In order to set the minimum and maximum values, load a Sentinel-1 Quarterly Mosaic VV scene, apply this custom script, and create an area of interest. Use the Histogram tool to understand the distribution of backscatter values, and set min and max parameter accordingly. If necessary, you can then tweak the values in the palette - the first two categories with white color should represent mangrove.
Descriptive images
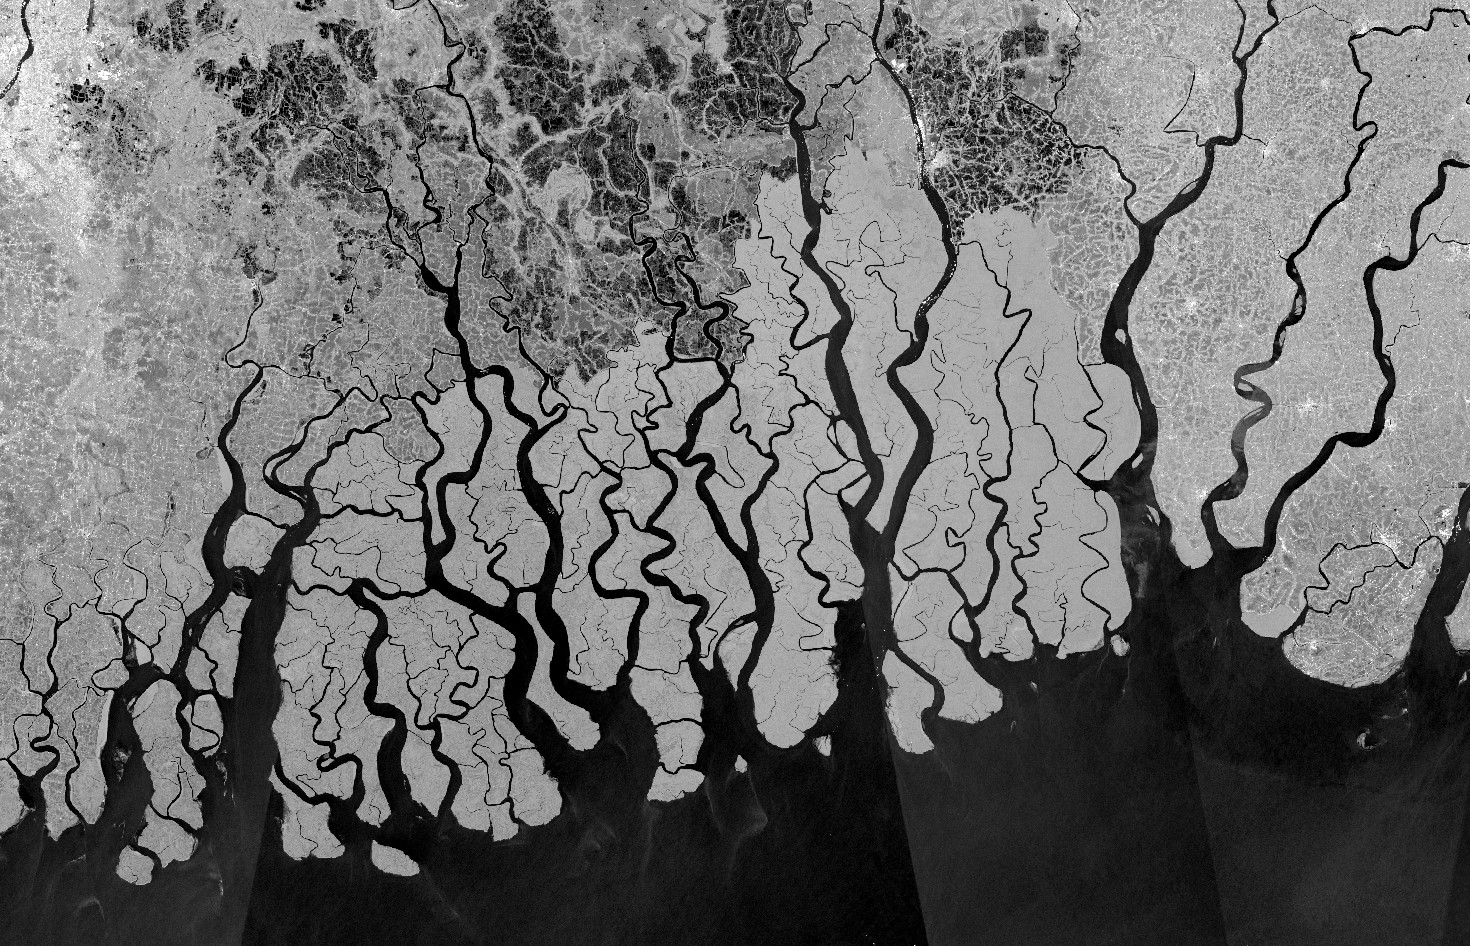
Mangrove area in the Sundarbans with Sentinel-1 VV db gamma0 default visualization
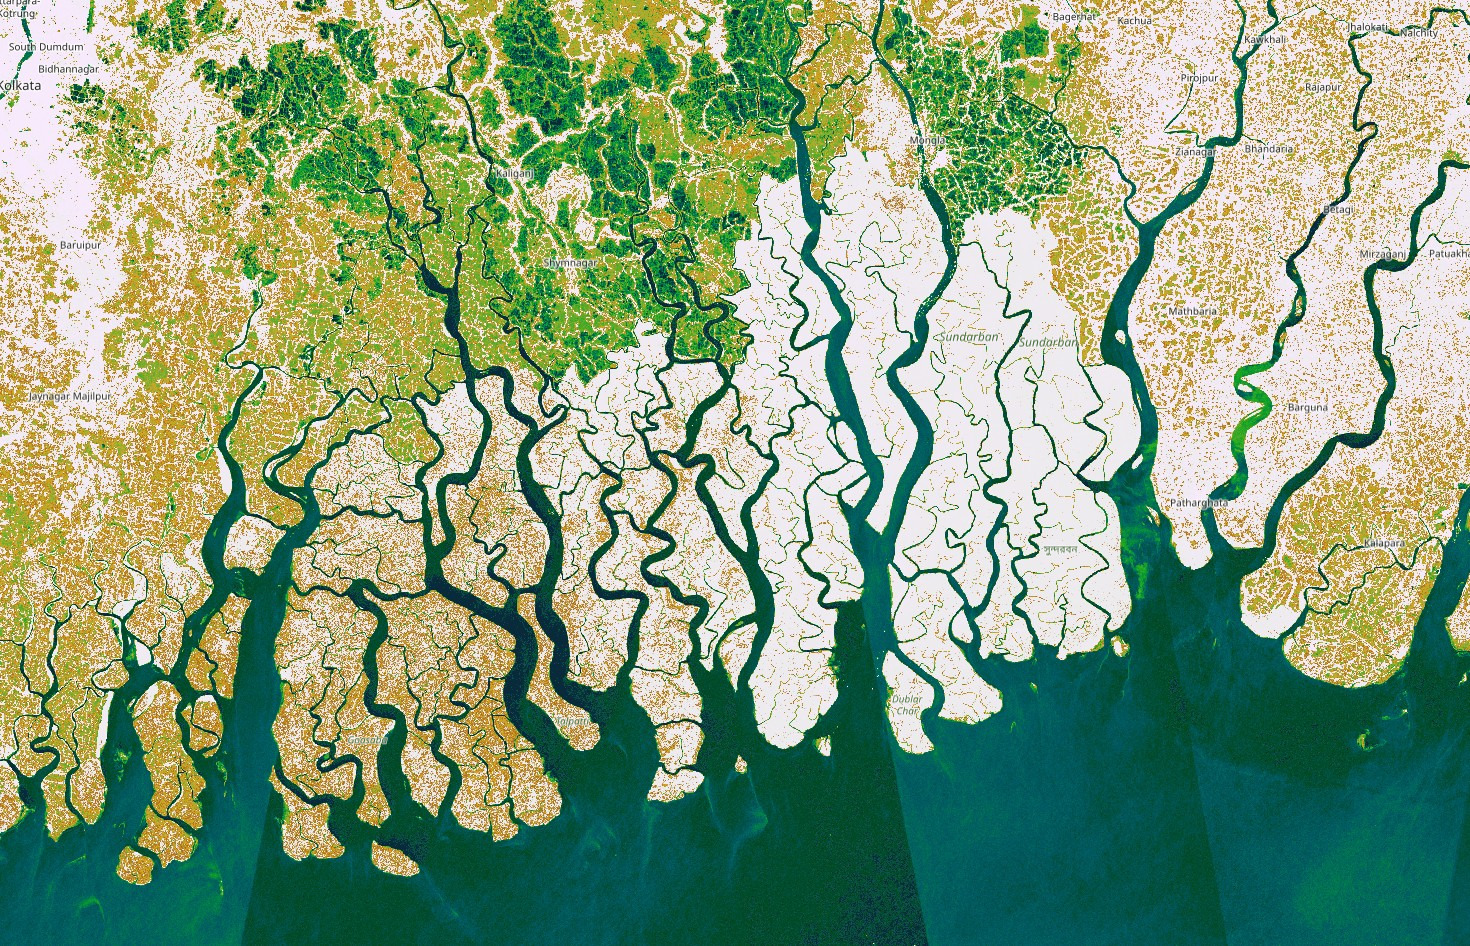
Mangrove area in the Sundarbans with Mangrove Radar visualization (slightly adjusted max value)
What to do if you are concerned about protecting mangrove but don’t live in an area with mangrove forests
- Only buy responsibly sourced seafood, especially shrimp. Shrimp farming is one of the main drivers of mangrove loss worldwide.
- Reduce your carbon footprint (fly less, use a bike, use less fossil fuel based energy). The other main driver of mangrove loss is climate change and the associated sea level rise.