Mapping Soybean and Maize NDVI with Sentinel-1 and Sentinel-2
//VERSION=3
//Author: Maxim Lamare

function setup() {
  return {
    input: [
      { datasource: "S1GRD", bands: ["VV", "VH"] },
      { datasource: "S2L2A", bands: ["B02", "B03", "B08", "B04", "SCL"] }],
    output: [
      { id: "default", bands: 3, sampleType: SampleType.AUTO }
    ]
  }
}

function toDb(linear) {
  // Convert the linear backscatter to DB (Filgueiras et al. (2019), eq. 3)
  return 10 * Math.LN10 * linear
}

function calc_s1_ndvi(sigmaVV, sigmaVH) {
  // Convert sigma0 to Decibels
  let vh_Db = toDb(sigmaVH)
  let vv_Db = toDb(sigmaVV)

  // Calculate NRPB (Filgueiras et al. (2019), eq. 4)
  let NRPB = (vh_Db - vv_Db) / (vh_Db + vv_Db)

  // Calculate NDVI_nc with approach A3 (Filgueiras et al. (2019), eq. 14)
  let NDVInc = 2.572 - 0.05047 * vh_Db + 0.176 * vv_Db + 3.422 * NRPB

  return NDVInc
}

function evaluatePixel(samples) {
  var s1 = samples.S1GRD[0]
  var s2 = samples.S2L2A[0]

  // Create an NDVI visualiser
  var viz = new ColorMapVisualizer([
    [0.0, 0xa50026],
    [0.0, 0xd73027], [0.2, 0xf46d43],
    [0.3, 0xfdae61], [0.4, 0xfee08b],
    [0.5, 0xffffbf], [0.6, 0xd9ef8b],
    [0.7, 0xa6d96a], [0.8, 0x66bd63],
    [0.9, 0x1a9850], [1.0, 0x006837]]);
  // Calculate S2 NDVI
  let ndvi = index(s2.B08, s2.B04)
  // Calculate S1 NDVI
  let s1_ndvi = calc_s1_ndvi(s1.VV, s1.VH)

  // Use the S2-L2A classification to identify clouds
  if ([7, 8, 9, 10].includes(s2.SCL)) {
    // If clouds are present use S1 NDVI
    return {
      default: viz.process(s1_ndvi)
    }
  } else {
    // Otherwise use s2 NDVI
    return {
      default: viz.process(ndvi)
    }
  }
}Evaluate and visualize
General description of the script
NDVI is a widely used vegetation index that uses Near Infra-Red (NIR) and Red wavelengths to measure the photosynthetic capacity of plant canopies. This index is a widely-used tool to assess agricultural crop conditions throughout the phenological cycle of the crops, linking chlorophyll activity to yield or canopy health [e.g. 1, 2].
Sentinel-2 is an ideal tool to monitor NDVI based on its NIR (B08, 842 nm) and Red bands (B04, 665 nm), owing to its large coverage, high spatial resolution (10/20 m), regular overpasses (~ 5 days) in comparison to other sensors. However, depending on the region and time of year, cloud cover can lead to sparse observations with the consequence of missing key stages of vegetation growth or activity. Furthermore, a 5-day revisit-time may not be sufficient to capture rapid changes in vegetation cover. Therefore, the combined use of multiple data sources is key for monitoring NDVI.
Studies have linked Synthetic Aperture Radar (SAR) backscattering data to vegetation development [e.g. 3, 4], and in particular to NDVI [5]. C-band SAR satellites such as Sentinel-1 offer frequent (~ 6 days) high-resolution observations of the Earth’s surface that have the advantage of being unaffected by cloud cover.
In this example, we combine a Sentinel-2 L2A NDVI product partly occulted by clouds with Sentinel-1 GRD observation to produce a seamless NDVI product, based on the relationship between radar backscatter and NDVI [5].
Note:
The method developed by Filgueiras et al. (2019) is based on regression algorithms between Sentinel-2 and Sentinel-1 images. For simplicity, the A3 approach with a linear regression is used in this example. However, it should be noted that the approach is less accurate for areas with low biomass (NDVI < 0.25). Although the method enables the monitoring of vegetation independently of optical sensors, calibration for the type of crop is needed. For illustration purposes here, the algorithm was applied to an area consisting mostly of sorghum and wheat. However, the regression parameters obtained from Filgueiras et al. (2019) for soybean and maize were not changed, thus leading to a bias in the absolute values of NDVI.
Description of representative images
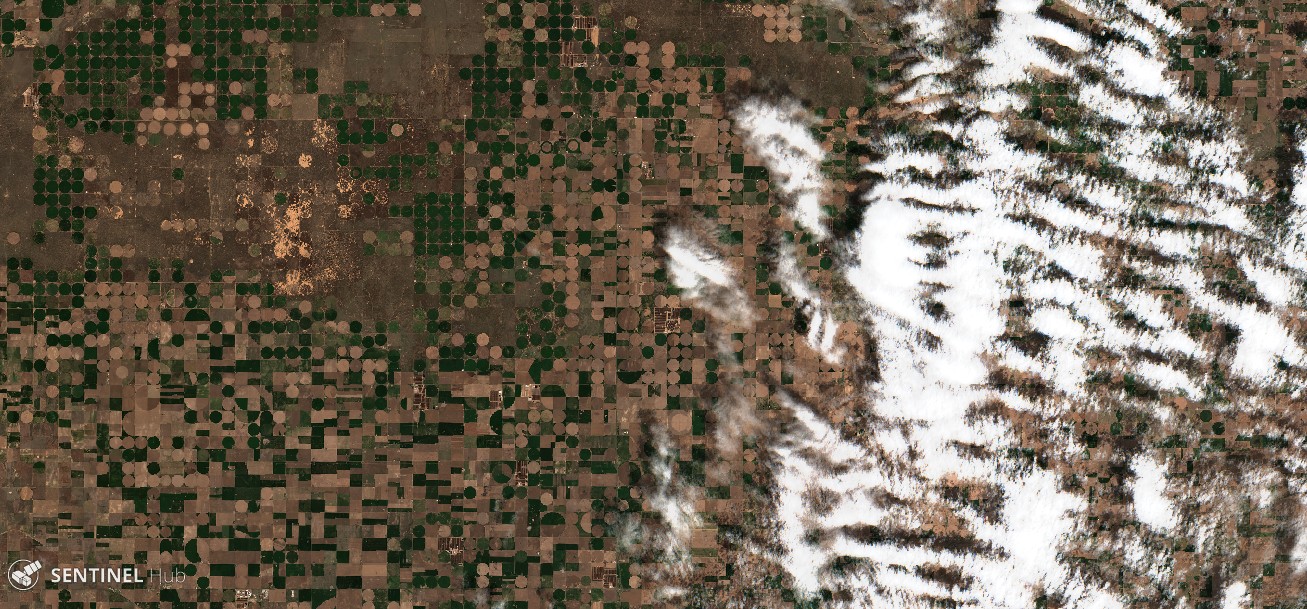
- Sentinel-2 L2A True Color Composite (enhanced), West Kansas.
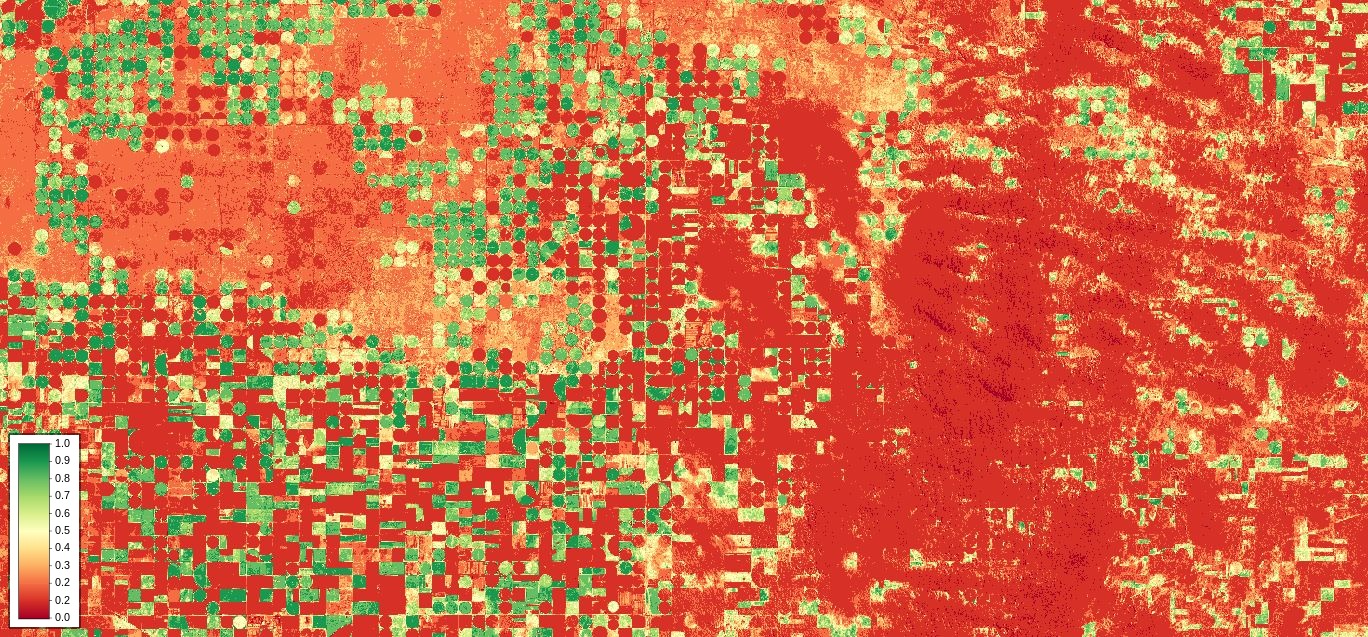
- Sentinel-2 L2A NDVI, West Kansas.
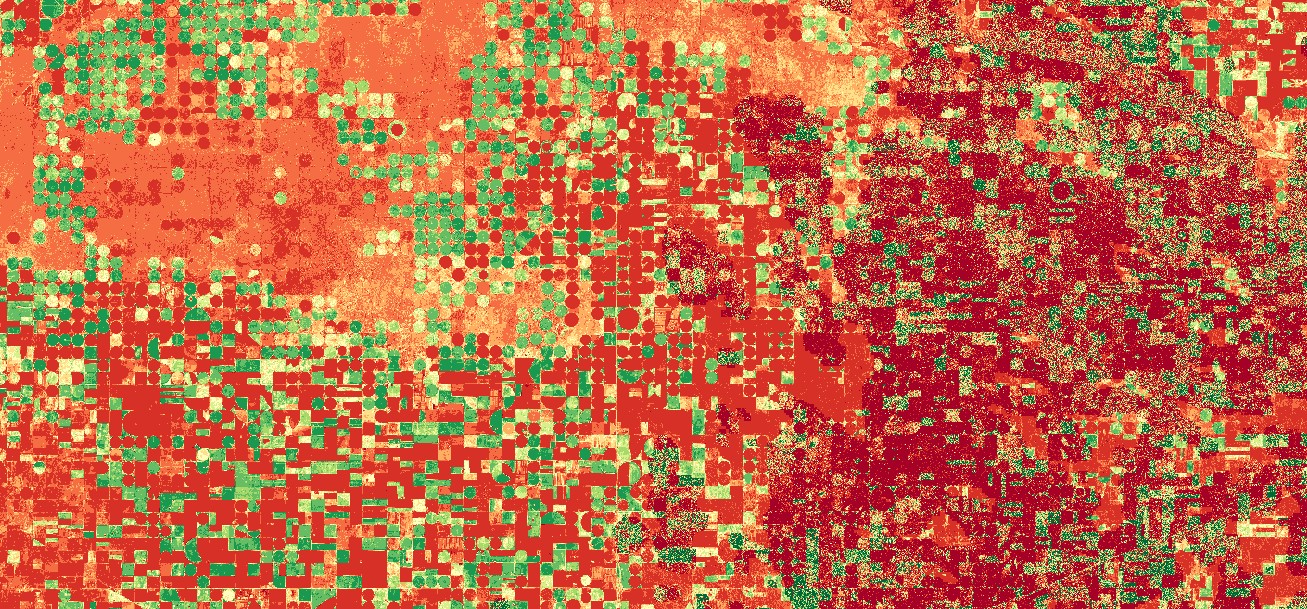
- Sentinel-2 L2A / Sentinel-1 GRD NDVI, West Kansas.
References
[1] Quarmby et al., 1993, The use of multi-temporal NDVI measurements from AVHRR data for crop yield estimation and prediction, DOI: 10.1080/01431169308904332.
[2] Mazzetto et al., 2010, Integration of optical and analogue sensors for monitoring canopy health and vigour in precision viticulture, DOI: 10.1007/s11119-010-9186-1.
[3] Capodici et al., 2013, Investigating the Relationship between X-Band SAR Data from COSMO-SkyMed Satellite and NDVI for LAI Detection. DOI: 10.3390/rs5031389.
[4] Inoue et al., 2014, Capability of C-band backscattering coefficients from high-resolution satellite SAR sensors to assess biophysical variables in paddy rice, DOI: 10.1016/j.rse.2013.09.001.
[5] Filgueiras et al., 2019, Crop NDVI Monitoring Based on Sentinel 1, DOI: 10.3390/rs11121441.
Contributors:
Maxim Lamare