Landsat 8 NDWI
//VERSION=3
//ndwi
const colorRamp1 = [
  	[0, 0xFFFFFF],
  	[1, 0x008000]
  ];
const colorRamp2 = [
  	[0, 0xFFFFFF],
  	[1, 0x0000CC]
  ];

let viz1 = new ColorRampVisualizer(colorRamp1);
let viz2 = new ColorRampVisualizer(colorRamp2);

function setup() {
  return {
    input: ["B03", "B05", "dataMask"],
    output: [
		{ id:"default", bands: 4 },
        { id: "index", bands: 1, sampleType: "FLOAT32" }
	]
  };
}

function evaluatePixel(samples) {
  let val = index(samples.B03, samples.B05);
  let imgVals = null;
  // The library for tiffs works well only if there is only one channel returned.
  // So we encode the "no data" as NaN here and ignore NaNs on frontend.
  const indexVal = samples.dataMask === 1 ? val : NaN;

  if (val < -0) {
    imgVals = [...viz1.process(-val), samples.dataMask];
  } else {
    imgVals = [...viz2.process(Math.sqrt(Math.sqrt(val))), samples.dataMask];
  }
  return {
    default: imgVals,
    index: [indexVal]
  };
}Evaluate and Visualize
General description of the script
The NDWI is used to monitor changes related to water content in water bodies. As water bodies strongly absorb light in visible to infrared electromagnetic spectrum, NDWI uses green and near infrared bands to highlight water bodies. It is sensitive to built-up land and can result in over-estimation of water bodies.
NDWI = (GREEN - NIR) / (GREEN + NIR)
For Landsat 7 ETM+, the index calculates as:
NDWI = (B03 - B05) / (B03 + B05)
Values description: Index values greater than 0.5 usually correspond to water bodies. Vegetation usually corresponds to much smaller values and built-up areas to values between zero and 0.2.
See also this page.
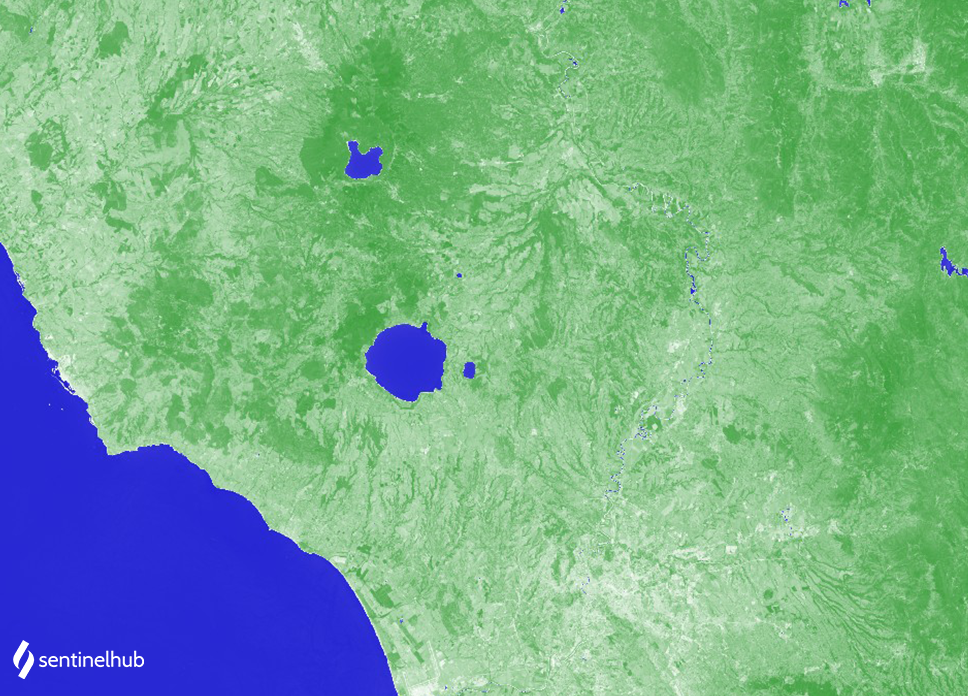
Description of representative images
The NDWI over Rome. Acquired on 2020-07-30.