MODIS Salinity Index
////VERSION=3 (auto-converted from 1)
// MODIS Normalized Difference Salinity Index (NDSI)
// https://www.indexdatabase.de/db/si-single.php?rsindex_id=57=&sensor_id=14

let viz = ColorRampVisualizer.createWhiteGreen(-0.89, 0.89);

function evaluatePixel(samples) {
  let val = index(samples.B06, samples.B07);
  return [...viz.process(val), samples.dataMask];
}

function setup() {
  return {
    input: [
      {
        bands: ["B06", "B07", "dataMask"],
      },
    ],
    output: { bands: 4 },
  };
}Evaluate and visualize
Description
The salinity index visualizes the amount of salt present in soils. Soil salinization is one of the most common land degradation processes, especially in arid and semi-arid regions, where precipitation exceeds evaporation.
Higher values indicate higher salinity and low values indicate lower salinity.
For MODIS, salinity index calculation, as proposed by the IndexDB, is calculated using SWIR16 band 6 and SWIR22 band 7:
NDVI = (B06 - B07) / (B06 + B07)
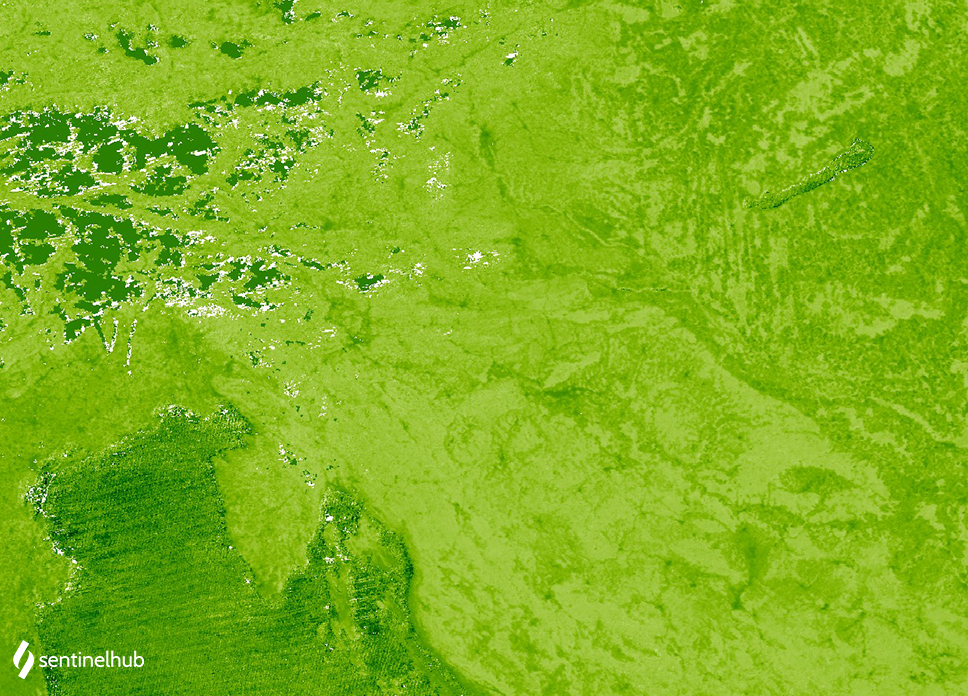
Description of representative images
MODIS salinity index of Europe. Acquired on 5. february of 2020, processed by Sentinel Hub.