Global Surface Water Occurrence Change Intensity visualisation script
//VERSION=3

//This script visualizes the occurrence change intensity layer according to the Global Surface Water data user guide.

//Set up input and output settings
function setup() {
  return {
    input: ["change"],
    output: {
      bands: 3,
      sampleType: "AUTO"
    }
  }
}

//Create color ramp
const ramps = [
  [0, 0xff0000],    //-100% loss of occurrence (Pure red)
  [100, 0x000000],  //No change (Black)
  [200, 0x00ff00]   //100% increase in occurrence (Pure lime green)
];

//Create visualizer
const visualizer = new ColorRampVisualizer(ramps);

//EvaluatePixel function
function evaluatePixel(sample) {
  if (sample.change == 253){  //Not water
    return [1, 1, 1]          //Return White
  }else if (sample.change == 254){  //Unable to calculate a value due to no homologous months
    return [0.533, 0.533, 0.533]    //Return Dark gray
  }else if (sample.change == 255){  //No data
    return [0.8, 0.8, 0.8]          //Return Light gray
  }else if (sample.change <= 200){  //loss and increase of occurrence
    return [visualizer.process(sample.change)[0], visualizer.process(sample.change)[1], visualizer.process(sample.change)[2]];  //Return color ramp values
  }
}General description of the script
This script visualizes the Occurrence Change Intensity layer from the Global Surface Water dataset according to the official symbology (Table 1). The Occurrence Change Intensity layer visualises changes in water occurrence between two different epochs, the first ranging from March 1984 to December 1999, and the other covering the period from January 2000 to December of the selected review year.
Table 1: Occurrence Change Intensity Symbology
| Value | Symbol | Colour | Label |
|---|---|---|---|
| 0 | 0xff0000 | -100% loss of occurrence | |
| 100 | 0x000000 | No change | |
| 200 | 0x00ff00 | 100% increase in occurrence | |
| 253 | 0xffffff | Not water | |
| 254 | 0x888888 | Unable to calculate a value due to no homologous months | |
| 255 | 0xcccccc | No data |
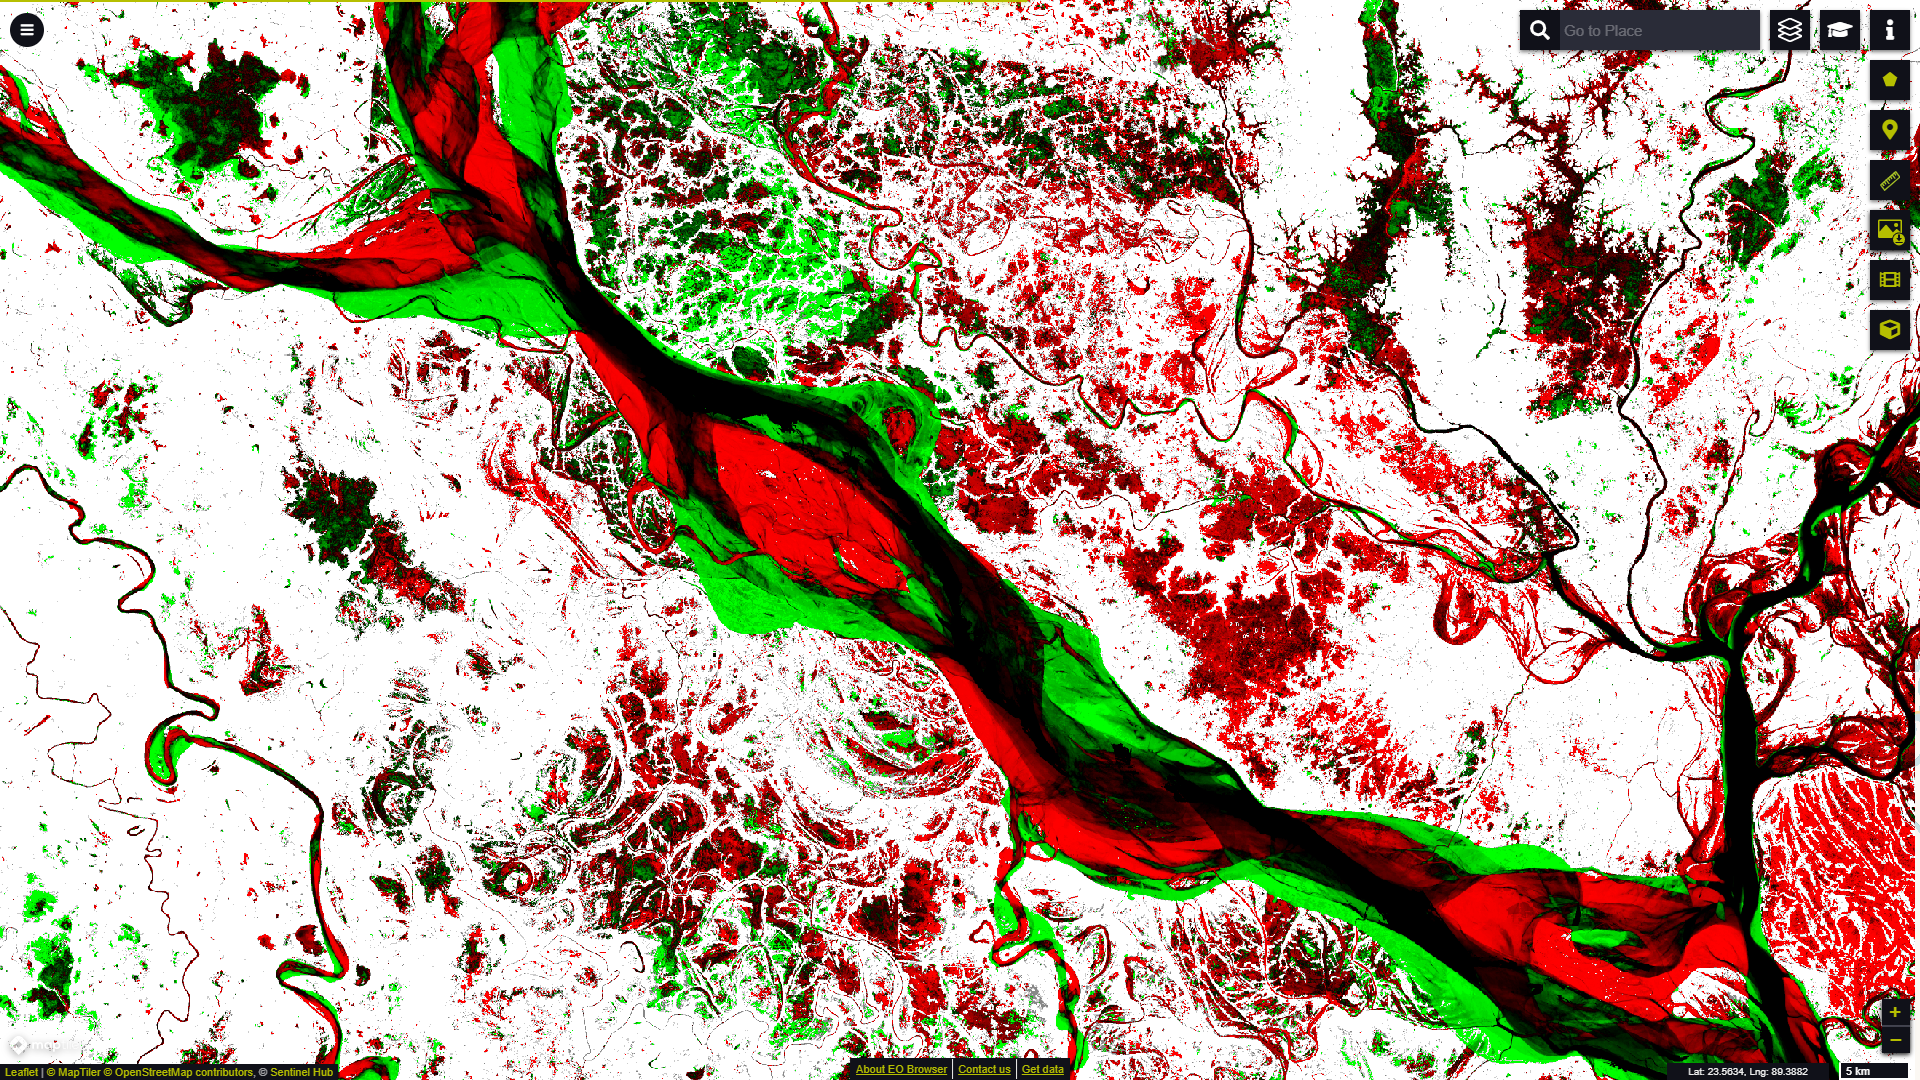
Description of representative images
Occurrence Change Intensity layer visualisation in EO Browser for a section of the Padma River, the main distributary of the Ganges, in Bangladesh.