Global Surface Water Occurrence visualisation script
//VERSION=3

//This custom script visualises the water occurrence layer similar to the symbology described in the data user guide with a slightly different color stretch.

//Set up input and output settings
function setup() {
  return {
    input: ["occurrence"],
    output: {
      bands: 3,
      sampleType: "AUTO"
    }
  }
}

//Create color ramp
const ramps = [
  [1, 0xffcccc],  //1% occurrence (Light red)
  [100, 0x0000ff] //100% occurrence (Pure blue)
];

//Create visualizer
const visualizer = new ColorRampVisualizer(ramps);

//EvaluatePixel function
function evaluatePixel(sample) {
  if (sample.occurrence == 0){  //Not water
    return [1, 1, 1]            //Return White
  }else if (sample.occurrence > 100){ //No data
    return [0.8, 0.8, 0.8]            //Return Light gray
  }else if (sample.occurrence > 0 && sample.occurrence <= 100){ //1 - 100% occurrence
    return [visualizer.process(sample.occurrence)[0], visualizer.process(sample.occurrence)[1], visualizer.process(sample.occurrence)[2]];  //Return color ramp values
  }
}General description of the script
This script visualizes the Occurrence layer from the Global Surface Water dataset according to the official symbology (Table 1). The water Occurrence layer shows the (intra- and inter-annual) variations of surface water presence in the time range between March 1984 and December of the selected review year.
Table 1: Occurrence Symbology
| Value | Symbol | Colour | Label |
|---|---|---|---|
| 0 | 0xffffff | Not water | |
| 1 | 0xffcccc | 1% occurrence | |
| 100 | 0x0000ff | 100% occurrence | |
| 255 | 0xcccccc | No data |
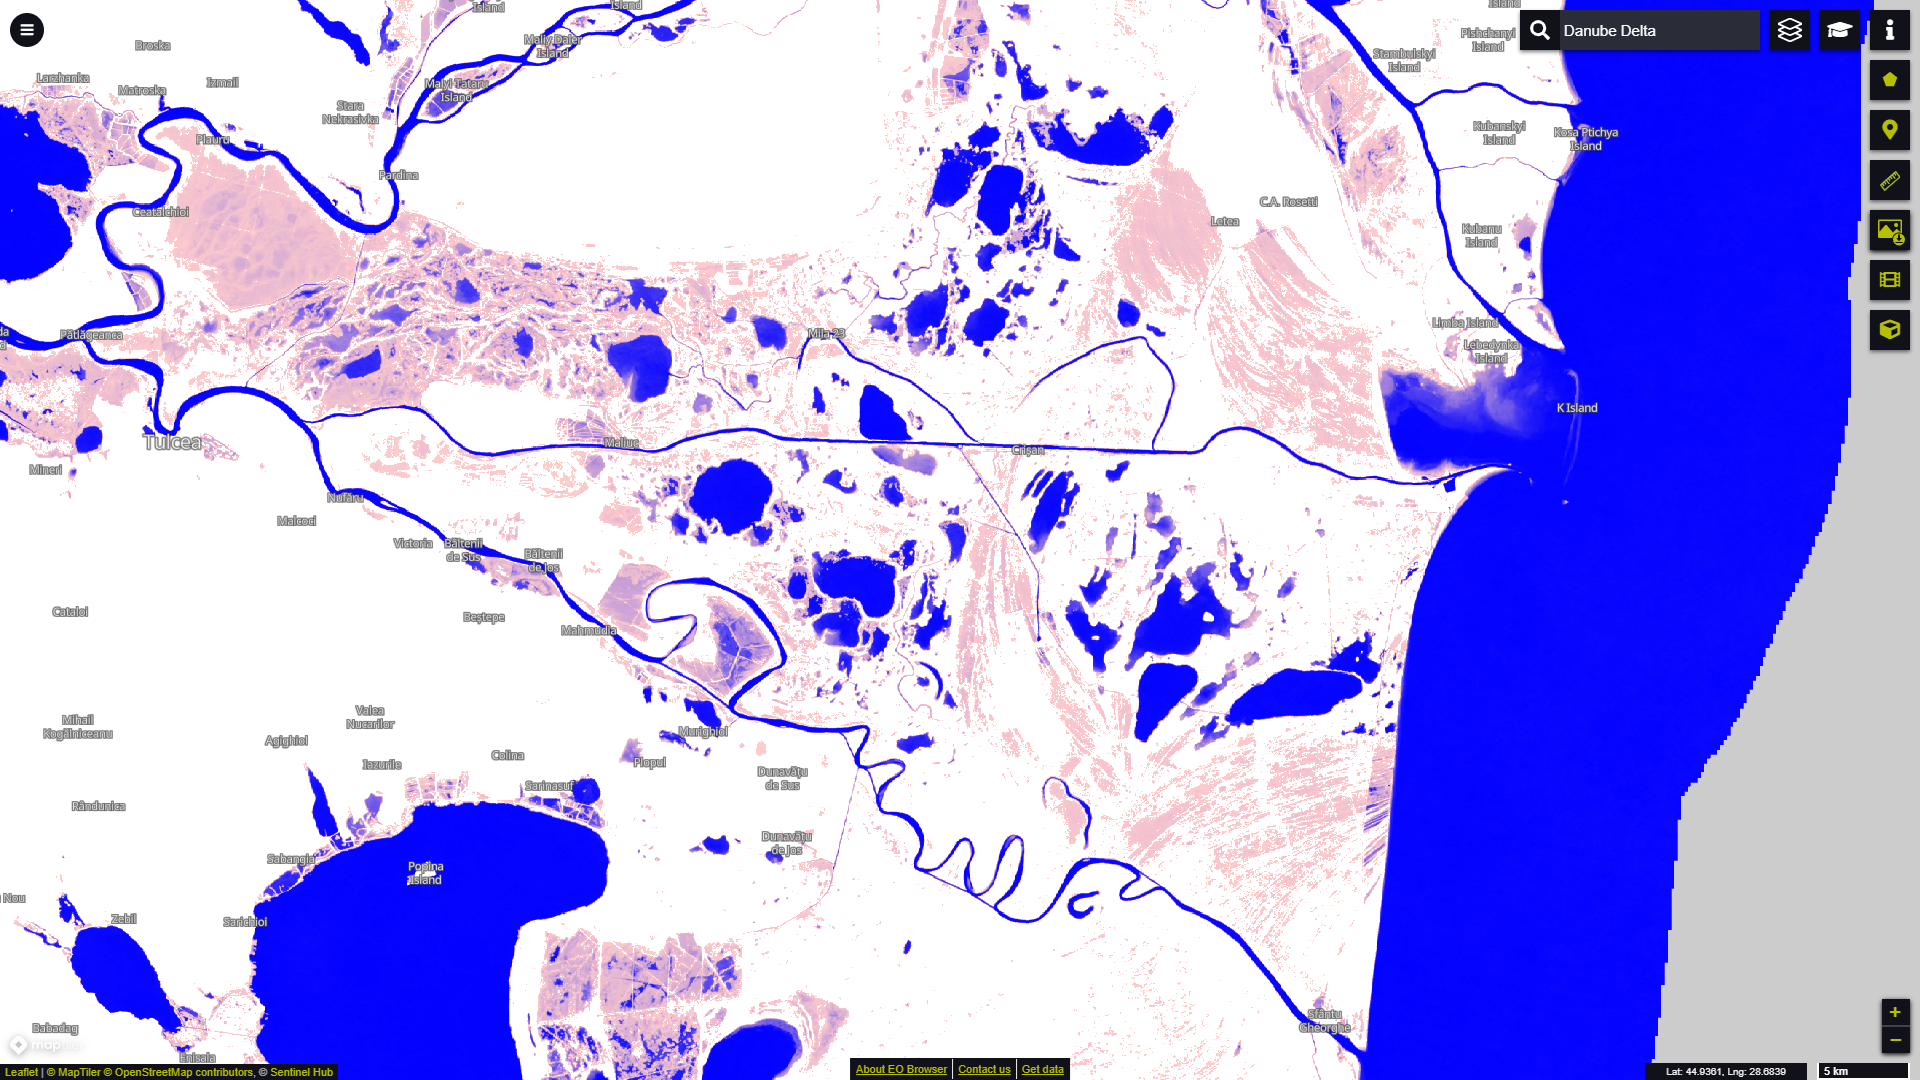
Description of representative images
Occurrence layer visualisation in EO Browser for the Danube Delta in Romania.