Global Surface Water Seasonality visualisation script
//VERSION=3

//This custom script visualises the seasonality layer according to the data user guide.

//Set up input and output settings
function setup() {
  return {
    input: ["seasonality"],
    output: {
      bands: 3,
      sampleType: "AUTO"
    }
  }
}

//Create color ramp
const ramps = [
  [1, 0x99d9ea],  //1 month of water (Very soft cyan)
  [12, 0x0000aa]  //12 months of water - permanent water (Dark blue)
];

//Create visualizer
const visualizer = new ColorRampVisualizer(ramps);

//EvaluatePixel function
function evaluatePixel(sample) {
  if (sample.seasonality == 0){ //Not water
    return [1, 1, 1]            //Return White
  }else if (sample.seasonality > 12){ //No data
    return [0.8, 0.8, 0.8]            //Return Light gray
  }else if (sample.seasonality > 0 && sample.seasonality <= 12){  //1 - 12 month of water
    return [visualizer.process(sample.seasonality)[0], visualizer.process(sample.seasonality)[1], visualizer.process(sample.seasonality)[2]]; //Return color ramp values
  }
}General description of the script
This script visualizes the Seasonality layer from the Global Surface Water dataset according to the official symbology (Table 1). The Seasonality layer provides information on the intra-annual distribution of surface water in the selected review year.
Table 1: Seasonality Symbology
| Value | Symbol | Colour | Label |
|---|---|---|---|
| 0 | 0xffffff | Not water | |
| 1 | 0x99d9ea | 1 month of water | |
| 12 | 0x0000aa | 12 months of water (permanent water) | |
| 255 | 0xcccccc | No data |
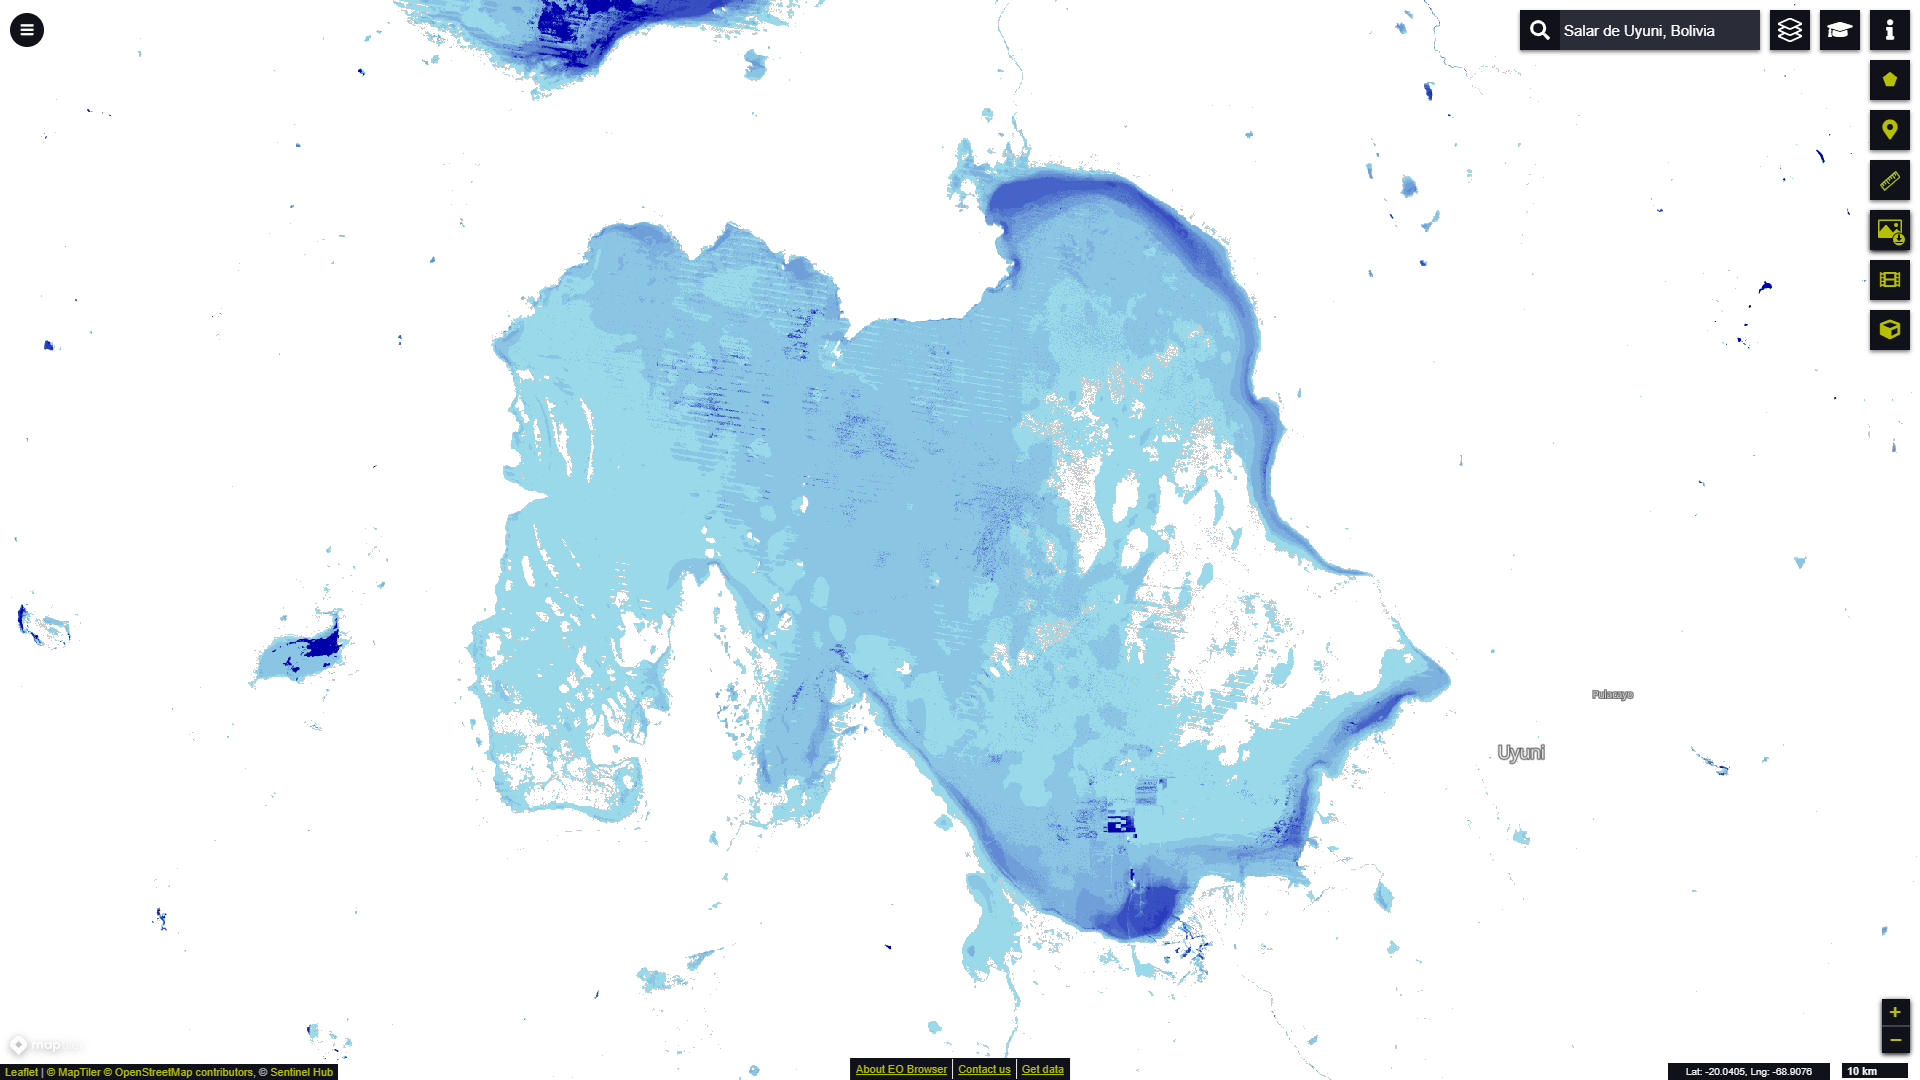
Description of representative images
Eo Browser visualisation of surface water Seasonality in the world’s largest salt flat Salar de Uyuni in southwest Bolivia.