Aboveground Carbon Density, Forest Carbon Diligence
//VERSION=3
const defaultVis = true;
const max = 175;
const min = 0;

function setup() {
  return {
    input: ["ACD", "dataMask"],
    output: { bands: 4, sampleType: "AUTO" },
  };
}

function updateMap(max, min) {
  const numIntervals = map.length;
  const intervalLength = (max - min) / (numIntervals - 1);
  for (let i = 0; i < numIntervals; i++) {
    map[i][0] = max - intervalLength * i;
  }
}

const map = [
  [175, 0xe5dd26],
  [155, 0xced62f],
  [140, 0x9ec54a],
  [125, 0x63b16e],
  [110, 0x38a183],
  [95, 0x1b8583],
  [80, 0x1e8589],
  [65, 0x206378],
  [50, 0x2e4c67],
  [35, 0x2a3f62],
  [20, 0x2d1a4e],
  [5, 0x2e164c],
  [0, 0x360245],
];

const visualizer = new ColorRampVisualizer(map, min, max);

function evaluatePixel(sample) {
  let val = sample.ACD;
  let imgVals = visualizer.process(val);

  return [...imgVals, sample.dataMask];
}
//VERSION=3
// To set custom max and min values, set
// defaultVis to false and choose your max and
// min values. The color map will then be scaled
// to those max and min values
const defaultVis = true;
const max = 175;
const min = 0;
function setup() {
return {
input: ["ACD", "dataMask"],
output: [
{ id: "default", bands: 4 },
{ id: "index", bands: 1, sampleType: "INT16" },
{ id: "eobrowserStats", bands: 1, sampleType: "FLOAT32" },
{ id: "dataMask", bands: 1 },
],
};
}
function updateMap(max, min) {
const numIntervals = map.length;
const intervalLength = (max - min) / (numIntervals - 1);
for (let i = 0; i < numIntervals; i++) {
map[i][0] = max - intervalLength * i;
}
}
const map = [
[175, 0xe5dd26],
[155, 0xced62f],
[140, 0x9ec54a],
[125, 0x63b16e],
[110, 0x38a183],
[95, 0x1b8583],
[80, 0x1e8589],
[65, 0x206378],
[50, 0x2e4c67],
[35, 0x2a3f62],
[20, 0x2d1a4e],
[5, 0x2e164c],
[0, 0x360245],
];
const visualizer = new ColorRampVisualizer(map, min, max);
function evaluatePixel(sample) {
let val = sample.ACD;
let imgVals = visualizer.process(val);
return {
default: imgVals.concat(sample.dataMask),
index: [val],
eobrowserStats: [val],
dataMask: [sample.dataMask],
};
}//VERSION=3
function setup() {
return {
input: ["ACD"],
output: { bands: 1, sampleType: "INT16" },
};
}
function evaluatePixel(sample) {
return [sample.ACD];
}Evaluate and visualize
As Forest Carbon Diligence is commercial data, brought into Sentinel Hub as Bring Your Own Data, direct EO Browser links are not possible due to the personalized data credentials.
General description
Aboveground carbon density quantifies the expected density of carbon stored in woody biomass across the landscape, measured in mass per area (megagrams of carbon per hectare). It is not a direct estimate of the total carbon in that pixel, as the spatial resolution of each pixel is less than one hectare. To estimate total carbon in a pixel, users should normalize these values to account for the size of each pixel, or average the density values to 1 hectare in an equal area projection.
The data layer has four bands:
- Aboveground Carbon Density quantifies the density of carbon stored in woody vegetation, primarily trees and shrubs. Grassland, herbaceous, and soil carbon stocks are not quantified.
- Lower prediction bound (5th percentile) of the 90% prediction interval for model predictions at each pixel.
- Upper prediction bound (95th percentile) of the 90% prediction interval for model predictions at each pixel.
- Quality Assurance Flags describing the expected quality of satellite data measurements, and whether any temporal gap-filling was applied.
Description of representative images
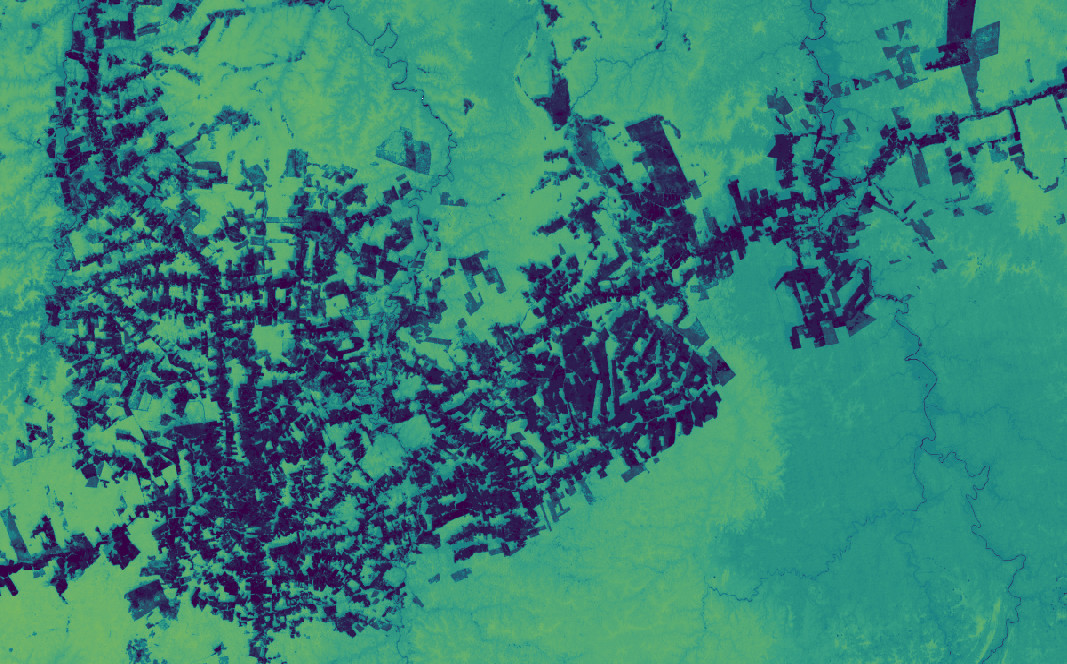
Aboveground Carbon Density in 2022 near Apui, Brazil.