Land Surface Temperature
//VERSION=3

// Set defaultVis to false to scaled and choose color_min and color_max values.
// LST has two observations per days: 1h30 and 13h30 solar local time

const defaultVis = true // true or false
const color_min = 290 // default min: 263
const color_max = 330 // default max: 340
const sensing_time = "0130" // "0130" or "1330" or ""
const variable = "LST" // LST or LST_MaskedPixels

//set the data for map and timeserie
function setup() {
    return {
        input: [variable, "dataMask"],
        output: { bands: 4 },
        mosaicking: "TILE"
    };
}

//Select files based on sensing time (0130 or 1330)
function preProcessScenes(collections) {
    collections.scenes.tiles = collections.scenes.tiles.filter(function (tile) {
        return tile.dataPath.includes("T" + sensing_time);
    })
    collections.scenes.tiles.sort((a, b) => new Date(b.date) - new Date(a.date));
    return collections
}

//Create color ramp 250 - 340 (full range)
const cmap = [
    [263, 0x000004],
    [266, 0x06051a],
    [270, 0x140e36],
    [274, 0x251255],
    [278, 0x3b0f70],
    [282, 0x51127c],
    [286, 0x641a80],
    [289, 0x782281],
    [293, 0x8c2981],
    [297, 0xa1307e],
    [301, 0xb73779],
    [305, 0xca3e72],
    [309, 0xde4968],
    [313, 0xed5a5f],
    [316, 0xf7705c],
    [320, 0xfc8961],
    [324, 0xfe9f6d],
    [328, 0xfeb77e],
    [332, 0xfecf92],
    [336, 0xfde7a9],
    [340, 0xfcfdbf],
];

//updated color ramp based on color_min and color_max
function updateCMap(min, max) {
    const numIntervals = cmap.length
    const intervalLength = (max - min) / (numIntervals - 1);
    for (let i = 0; i < numIntervals; i++) {
        cmap[i][0] = min + intervalLength * i
    }
}

// update the min max of color bar if defaultVis set to false
if (!defaultVis) updateCMap(color_min, color_max);

//initialize the ColorRamp
const visualizer = new ColorRampVisualizer(cmap);

function evaluatePixel(samples) {
    // LST scale factor
    const scaleFactor = 100;
    const datamask = samples[0].dataMask;

    // Precompute an array to contain observations
    var n_observations = samples.length;
    let array = new Array(n_observations).fill(0);

    // Fill the array with values
    samples.forEach((sample, index) => {
        array[index] = samples[index][variable] / scaleFactor;
    });

    // Get variable and apply scale factor
    for (var i = 0; i < samples.length; i++) {
        indexVal = samples[i][variable] / scaleFactor;
    }

    // Display
    let imgVals = visualizer.process(indexVal);
    return [...imgVals, datamask];
}
//VERSION=3
// To set custom max and min values, set
// defaultVis to false and choose your max and
// min values. The color map will then be scaled
// to those max and min values
// LST has two observations per days: 1h30 and 13h30 solar local time
const defaultVis = true; // true or false
const color_min = 263; // default min: 263
const color_max = 340; // default max: 340
const sensing_time = "1330"; // "0130" or "1330" or ""
//set the data for map and timeserie
function setup() {
return {
input: ["LST", "dataMask"],
output: [
{ id: "default", bands: 4 },
{ id: "index", bands: 1, sampleType: "FLOAT32" },
{ id: "eobrowserStats", bands: 1, sampleType: "FLOAT32" },
{ id: "dataMask", bands: 1 },
],
mosaicking: "TILE",
};
}
//Select files based on sensing time (0130 or 1330)
function preProcessScenes(collections) {
collections.scenes.tiles = collections.scenes.tiles.filter(function (tile) {
return tile.dataPath.includes("T" + sensing_time);
});
return collections;
}
//Create color ramp 263 - 340 (full range)
const cmap = [
[263, 0x000004],
[266, 0x06051a],
[270, 0x140e36],
[274, 0x251255],
[278, 0x3b0f70],
[282, 0x51127c],
[286, 0x641a80],
[289, 0x782281],
[293, 0x8c2981],
[297, 0xa1307e],
[301, 0xb73779],
[305, 0xca3e72],
[309, 0xde4968],
[313, 0xed5a5f],
[316, 0xf7705c],
[320, 0xfc8961],
[324, 0xfe9f6d],
[328, 0xfeb77e],
[332, 0xfecf92],
[336, 0xfde7a9],
[340, 0xfcfdbf],
];
//updated color ramp based on color_min and color_max
function updateCMap(min, max) {
const numIntervals = cmap.length;
const intervalLength = (max - min) / (numIntervals - 1);
for (let i = 0; i < numIntervals; i++) {
cmap[i][0] = min + intervalLength * i;
}
}
// update the min max of color bar if defaultVis set to false
if (!defaultVis) updateCMap(color_min, color_max);
//initialize the ColorRamp
const visualizer = new ColorRampVisualizer(cmap);
function evaluatePixel(samples) {
// LST scale factor
const scaleFactor = 100;
// use the first sample with a datamask of 1
let datamask = 0;
let val = NaN;
for (var i = 0; i < samples.length; i++) {
datamask = samples[i].dataMask;
if (datamask == 1) {
val = samples[i].LST / scaleFactor;
break;
}
}
return {
default: [...visualizer.process(val), datamask],
index: [val],
eobrowserStats: [val, datamask],
dataMask: [datamask],
};
}//VERSION=3
// Set defaultVis to false to scaled and choose color_min and color_max values.
// LST has two observations per days: 1h30 and 13h30 solar local time
const defaultVis = true // true or false
const color_min = 290 // default min: 263
const color_max = 330 // default max: 340
const sensing_time = "0130" // "0130" or "1330" or ""
const variable = "LST" // LST or LST_MaskedPixels
//set the data for map and timeseries
function setup() {
return {
input: [variable, "dataMask"],
output: { bands: 1, sampleType: "FLOAT32" },
mosaicking: "TILE"
};
}
//Select files based on sensing time (0130 or 1330)
function preProcessScenes(collections) {
collections.scenes.tiles = collections.scenes.tiles.filter(function (tile) {
return tile.dataPath.includes("T" + sensing_time);
})
collections.scenes.tiles.sort((a, b) => new Date(b.date) - new Date(a.date));
return collections
}
function evaluatePixel(samples) {
// LST scale factor
const scaleFactor = 100;
// Precompute an array to contain observations
var n_observations = samples.length;
let array = new Array(n_observations).fill(0);
// Fill the array with values
samples.forEach((sample, index) => {
array[index] = samples[index][variable] / scaleFactor;
});
// Get variable and apply scale factor
for (var i = 0; i < samples.length; i++) {
indexVal = samples[i][variable] / scaleFactor;
}
return [indexVal];
}Evaluate and visualize
As Land Surface Temperature is commercial data, brought into Sentinel Hub as Bring Your Own Data, direct EO Browser links are not possible due to the personalized data credentials.
General description
Land Surface Temperature (LST) is the thermodynamic temperature of Earth’s surface. LST is a key variable controlling energy, and water fluxes over the land surface and atmosphere interface. In view of increasing extreme temperature events and a growing population exposed to these events, LST is increasingly relevant to sustainably manage food and water systems and urban living conditions.
Planet’s LST product provides near real-time measurements twice a day at 1:30 and 13:30 solar local time and at spatial resolutions of 100 m and 1000 m. It is unhindered by clouds and has a long and consistent data record of more than 20 years. Please check here for a list of available bands.
The different times in the day can be selected in the evalscript by changing the variable sensing_time. const sensing_time = "0130"; will return the LST at nighttime and const sensing_time = "1330"; will return LST at midday.
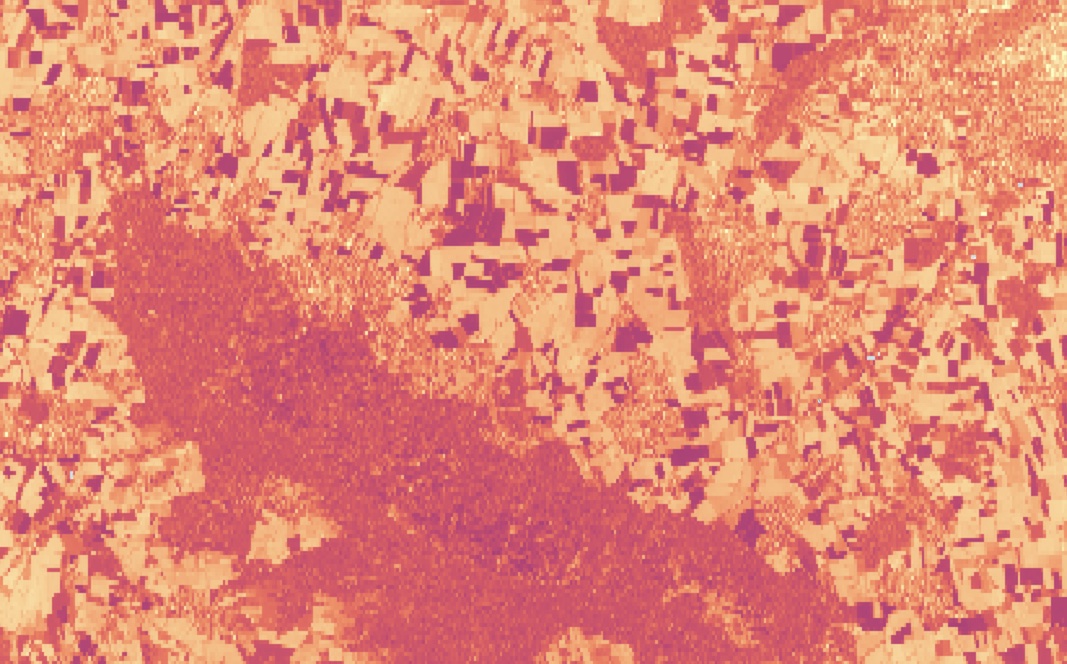
Description of representative images
Land Surface Temperature (100 m) on Oct 8, 2023 at 13:30 near Hanover, Germany.