Soil Water Content Anomaly
//VERSION=3
// Visualization
const vmin = -2;
const vmax = 2;
// tolerance in either direction, so i.e. +- 1 days
const toleranceDays = 1;

const band = "SWC";
const NODATA = NaN;

function setup() {
    return {
        input: [band, "dataMask"],
        output: { bands: 4 },
        mosaicking: "ORBIT",
    };
}

const msInDay = 24 * 60 * 60 * 1000;
const msInYear = 365.25 * msInDay;
const msInHalfYear = msInYear / 2;
const toleranceMs = toleranceDays * msInDay;

function updateColormap(vmin, vmax) {
    const numIntervals = cmap.length;
    const intervalLength = (vmax - vmin) / (numIntervals - 1);
    for (let i = 0; i < numIntervals; i++) {
        cmap[i][0] = vmin + intervalLength * i;
    }
}

const cmap = [
    [-3, 0x6d2400],
    [-2.25, 0xaa6000],
    [-1.5, 0xce9f57],
    [-0.75, 0xebd5a7],
    [0, 0xfef9e6],
    [0.75, 0xc0e0bb],
    [1.5, 0x57b7a2],
    [2.25, 0x008199],
    [3, 0x003492],
];

updateColormap(vmin, vmax);
const visualizer = new ColorRampVisualizer(cmap);

var metadata = undefined;

function relDiff(a, b) {
    const diff = Math.abs(a - b);
    return diff > msInHalfYear ? msInYear - diff : diff;
}

function datetimeToYearEpoch(date) {
    return date - new Date(Date.UTC(date.getUTCFullYear(), 0, 1));
}

function sortDatesDescending(d1, d2) {
    const date1 = new Date(d1.dateFrom);
    const date2 = new Date(d2.dateFrom);
    return date2 - date1;
}

var obsPerYear = [0];
function preProcessScenes(collections) {
    // sort
    let scenes = collections.scenes.orbits;
    if (scenes.length == 0) {
        return collections;
    }
    scenes = scenes.sort(sortDatesDescending);
    let newScenes = [];
    // convert first scene to day of year
    const observed = new Date(scenes[0].dateFrom);
    const obsMs = datetimeToYearEpoch(observed);
    var year = 0;
    for (let i = 0; i < scenes.length; i++) {
        let currentDate = new Date(scenes[i].dateFrom);
        let sceneMs = datetimeToYearEpoch(currentDate);
        let dt = relDiff(obsMs, sceneMs);
        if (dt <= toleranceMs) {
            newScenes.push(scenes[i]);
            obsPerYear[year]++;
        } else {
            if (obsPerYear[year] != 0) {
                year++;
                obsPerYear[year] = 0;
            }
        }
    }

    metadata = {
        observed: observed.toISOString(),
        historical: newScenes.slice(1).map((scene) => scene.dateFrom),
    };

    collections.scenes.orbits = newScenes;
    return collections;
}

function updateOutputMetadata(scenes, inputMetadata, outputMetadata) {
    outputMetadata.userData = metadata;
}

function sum(array) {
    let sum = 0;
    for (let i = array.length; i--; ) {
        sum += array[i];
    }
    return sum;
}

function mean(array) {
    return sum(array) / array.length;
}

function std(array, mean) {
    let sum = 0;
    for (let i = 0; i < array.length; i++) {
        sum += Math.pow(array[i] - mean, 2);
    }
    return Math.sqrt(sum / array.length);
}

function evaluatePixel(samples) {
    if (samples.length == 0) return [0, 0, 0, 0];
    if (!samples[0].dataMask) return [0, 0, 0, 0];
    const values = [];
    var yearIndex = 0;
    for (let i = 0; i < obsPerYear.length; i++) {
        let obsInYear = obsPerYear[i];
        if (obsInYear == 0) continue;
        let validObsInYear = 0;
        var yearSum = 0;
        for (let j = 0; j < obsInYear; j++) {
            var currentIndex = yearIndex + j;
            if (samples[currentIndex].dataMask) {
                yearSum += samples[currentIndex][band];
                validObsInYear++;
            }
        }
        if (validObsInYear) {
            const yearMean = yearSum / validObsInYear;
            values.push(yearMean);
        }
        yearIndex += obsInYear;
    }
    if (values.length === 0) return [0, 0, 0, 0];
    const valsMean = mean(values);
    const valsStd = std(values, valsMean);
    const anomaly = samples[0][band] - valsMean;
    const val = anomaly / valsStd;
    let imgVals = visualizer.process(val);
    return [...imgVals, samples[0].dataMask];
}
//VERSION=3
// tolerance in either direction, so i.e. +- 5 days
const toleranceDays = 1;
const band = "SWC";
const NODATA = NaN;
function setup() {
return {
input: [band, "dataMask"],
output: { bands: 1, sampleType: "FLOAT32" },
mosaicking: "ORBIT",
};
}
const msInDay = 24 * 60 * 60 * 1000;
const msInYear = 365.25 * msInDay;
const msInHalfYear = msInYear / 2;
const toleranceMs = toleranceDays * msInDay;
var metadata = undefined;
function relDiff(a, b) {
const diff = Math.abs(a - b);
return diff > msInHalfYear ? msInYear - diff : diff;
}
function datetimeToYearEpoch(date) {
return date - new Date(Date.UTC(date.getUTCFullYear(), 0, 1));
}
function sortDatesDescending(d1, d2) {
const date1 = new Date(d1.dateFrom);
const date2 = new Date(d2.dateFrom);
return date2 - date1;
}
var obsPerYear = [0];
function preProcessScenes(collections) {
// sort
let scenes = collections.scenes.orbits;
if (scenes.length == 0) {
return collections;
}
scenes = scenes.sort(sortDatesDescending);
let newScenes = [];
// convert first scene to day of year
const observed = new Date(scenes[0].dateFrom);
const obsMs = datetimeToYearEpoch(observed);
var year = 0;
for (let i = 0; i < scenes.length; i++) {
let currentDate = new Date(scenes[i].dateFrom);
let sceneMs = datetimeToYearEpoch(currentDate);
let dt = relDiff(obsMs, sceneMs);
if (dt <= toleranceMs) {
newScenes.push(scenes[i]);
obsPerYear[year]++;
} else {
if (obsPerYear[year] != 0) {
year++;
obsPerYear[year] = 0;
}
}
}
metadata = {
observed: observed.toISOString(),
historical: newScenes.slice(1).map((scene) => scene.dateFrom),
};
collections.scenes.orbits = newScenes;
return collections;
}
function updateOutputMetadata(scenes, inputMetadata, outputMetadata) {
outputMetadata.userData = metadata;
}
function sum(array) {
let sum = 0;
for (let i = array.length; i--; ) {
sum += array[i];
}
return sum;
}
function mean(array) {
return sum(array) / array.length;
}
function std(array, mean) {
let sum = 0;
for (let i = 0; i < array.length; i++) {
sum += Math.pow(array[i] - mean, 2);
}
return Math.sqrt(sum / array.length);
}
function evaluatePixel(samples) {
// Return transparent, if no value for most recent image
if (samples.length == 0) return [NODATA];
if (!samples[0].dataMask) return [NODATA];
const values = [];
var yearIndex = 0;
for (let i = 0; i < obsPerYear.length; i++) {
let obsInYear = obsPerYear[i];
if (obsInYear == 0) continue;
let validObsInYear = 0;
var yearSum = 0;
for (let j = 0; j < obsInYear; j++) {
var currentIndex = yearIndex + j;
if (samples[currentIndex].dataMask) {
yearSum += samples[currentIndex][band];
validObsInYear++;
}
}
if (validObsInYear) {
const yearMean = yearSum / validObsInYear;
values.push(yearMean);
}
yearIndex += obsInYear;
}
if (values.length === 0) return [NODATA];
const valsMean = mean(values);
const valsStd = std(values, valsMean);
const anomaly = samples[0][band] - valsMean;
return [anomaly / valsStd];
}Description of representative images
The visualization represents negative soil water content anomalies (less water content than on average) in shades of brown and positive soil water content anomalies (more water content than on average) in hues of green to blue.
Soil Water Content Anomaly (C band 1000 m) on June 3rd, 2023 Graz, Austria.
| True Color Image of AOI (June 9th) | Soil Water Content (SWC) | Standardized Anomaly of SWC |
|---|---|---|
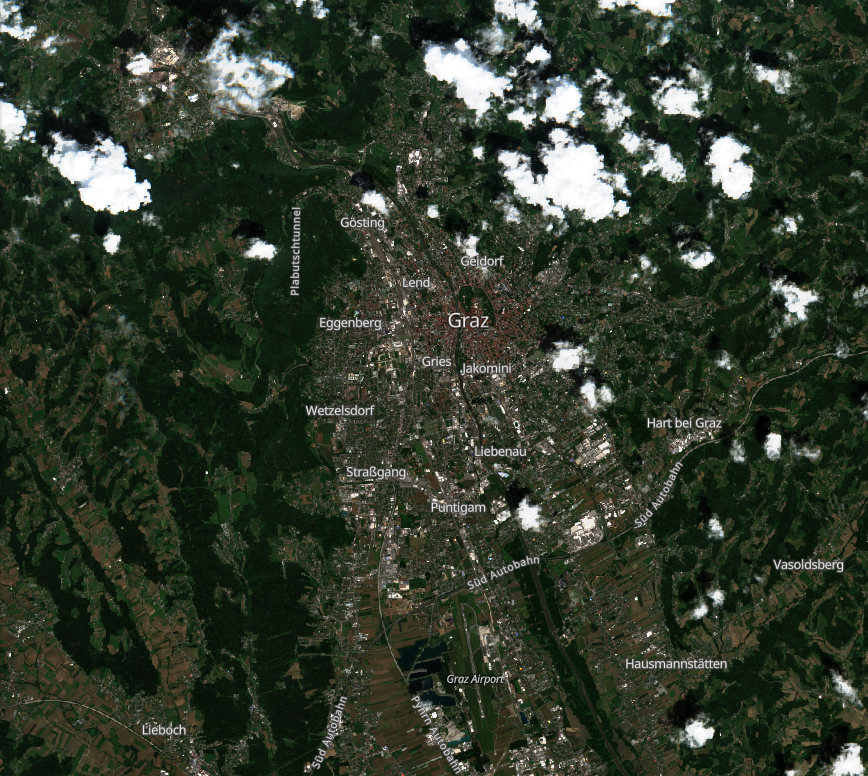 | 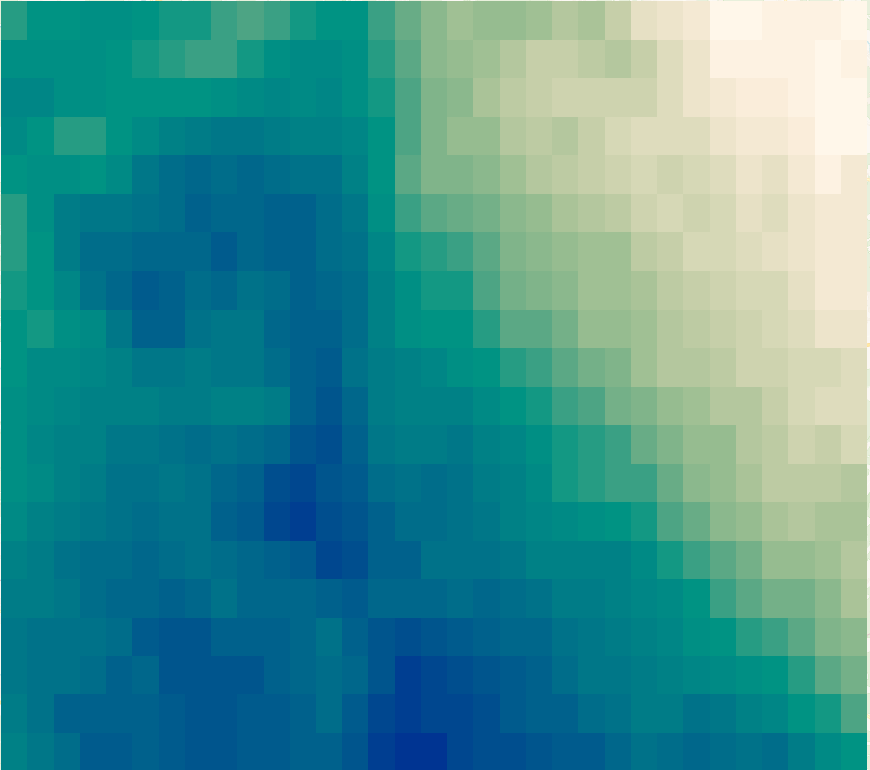 | 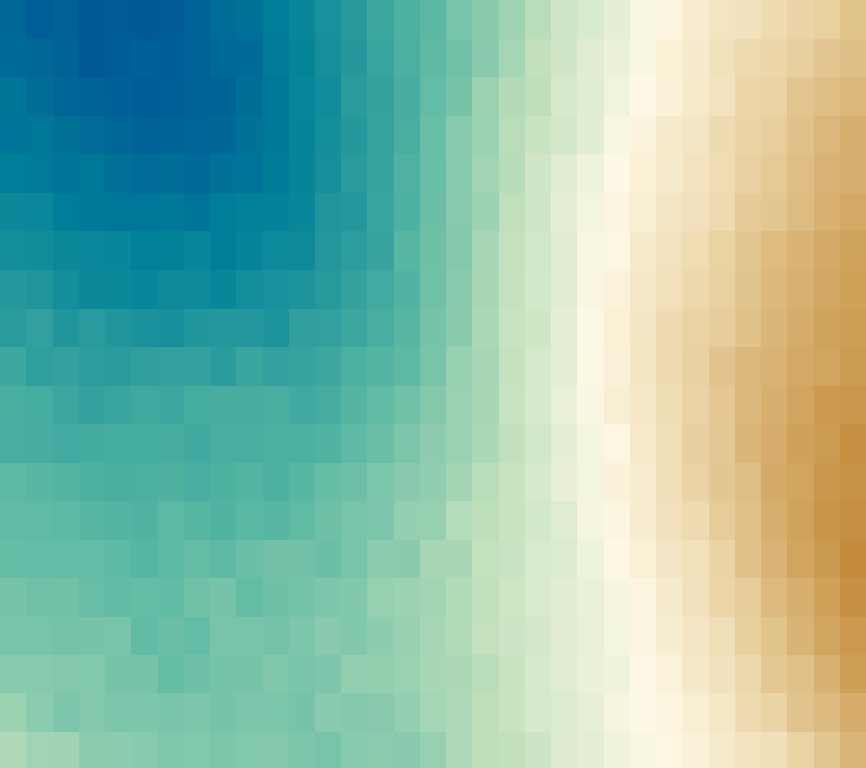 |
General description
This script calculates the standardized anomaly of the soil water content for a particular date. It takes all values of the same day of the year in previous years and calculates the mean and standard deviation of the value. The anomaly is then defined as the current value subtracted by the mean of the reference period. To get the standardized anomaly, the absolute anomaly value is then divided by the standard deviation of the reference period.
The standardized anomaly can be compared between different areas and different sensors and is the one produced by this script. If the absolute anomaly is desired the last step in the evalscript of dividing by the standard deviation can be removed. This then results in anomalies in the unit of measurement. In this case \(m^3/m^3\) below or above the mean water content during the reference period.
Notes on usage
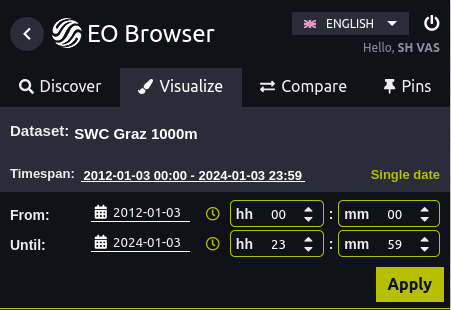
EO Browser
To use this script in the EO Browser, a time span needs to be set in the interface. To do this, visualize the date you want to calculate an anomaly for. Then in the Visualize panel, hit the green Timespan button.

In the interface which then appears, select the time range you want to use as reference period. In this case, we select a time range from 2012 to 2024, which is 12 years. Be aware that this will only include data which is available, so if you ordered data for 5 years but specify a time range of 10 years, only the 5 years you have ordered will be included.
Please note: The date that is compared to the reference period is always the most recent date with data in the selected time span.
Reference Period
The reference period represents which dates get included for each year and is determined by the variable toleranceDays in the evalscript. This variable determines how many days adjacent to the selected day are included in the calculation. If the day for which an anomaly is computed is the 10th of January 2024 and toleranceDays is 0, only data in previous years that are also exactly on the 10th of January will be considered. If toleranceDays is 1, for each year in the reference period, one day before and after the 10th of January will also be considered and included in the calculation.
If multiple values are available in a year, they will be averaged to form a yearly average. This average will then be used for the anomaly calculation. This is done to avoid bias, which would happen if one year has many more acquisitions available than other years.
Visualization
In the visualization script you can modify the color scale by changing the variables vmin and vmax. Those are the maximum and minimum values of the color ramp. If the anomaly is only very slight, you might want to change vmin and vmax to lower values to be able to see slight differences better.