Soil Water Content
//VERSION=3
const vmin = 0;
const vmax = 0.4;

function setup() {
    return {
        input: ["SWC", "dataMask"],
        output: { bands: 4 },
    };
}

function updateColormap(vmin, vmax) {
    const numIntervals = cmap.length;
    const intervalLength = (vmax - vmin) / (numIntervals - 1);
    for (let i = 0; i < numIntervals; i++) {
        cmap[i][0] = vmin + intervalLength * i;
    }
}

const cmap = [
    [0.0, 0xfff7ea],
    [0.05, 0xfaedda],
    [0.1, 0xede4cb],
    [0.15, 0xdedcbd],
    [0.2, 0xced3af],
    [0.25, 0xbdcba3],
    [0.3, 0xaac398],
    [0.35, 0x96bc90],
    [0.4, 0x80b48a],
    [0.45, 0x68ac86],
    [0.5, 0x4da484],
    [0.55, 0x269c83],
    [0.6, 0x009383],
    [0.65, 0x008a85],
    [0.7, 0x008186],
    [0.75, 0x007788],
    [0.8, 0x006d8a],
    [0.85, 0x00618c],
    [0.9, 0x00558d],
    [0.95, 0x00478f],
    [1.0, 0x003492],
];

updateColormap(vmin, vmax);
const visualizer = new ColorRampVisualizer(cmap);

function evaluatePixel(sample) {
    let scaleFactor = 1000;
    let val = sample.SWC / scaleFactor;

    let imgVals = visualizer.process(val);
    return [...imgVals, sample.dataMask];
}
//VERSION=3
// To set custom max and min values, set
// defaultVis to false and choose your max and
// min values. The color map will then be scaled
// to those max and min values
const vmin = 0;
const vmax = 0.4;
function setup() {
return {
input: ["SWC", "dataMask"],
output: [
{ id: "default", bands: 4 },
{ id: "index", bands: 1, sampleType: "FLOAT32" },
{ id: "eobrowserStats", bands: 1, sampleType: "FLOAT32" },
{ id: "dataMask", bands: 1 },
],
};
}
function updateColormap(vmin, vmax) {
const numIntervals = cmap.length;
const intervalLength = (vmax - vmin) / (numIntervals - 1);
for (let i = 0; i < numIntervals; i++) {
cmap[i][0] = vmin + intervalLength * i;
}
}
const cmap = [
[0.0, 0xfff7ea],
[0.05, 0xfaedda],
[0.1, 0xede4cb],
[0.15, 0xdedcbd],
[0.2, 0xced3af],
[0.25, 0xbdcba3],
[0.3, 0xaac398],
[0.35, 0x96bc90],
[0.4, 0x80b48a],
[0.45, 0x68ac86],
[0.5, 0x4da484],
[0.55, 0x269c83],
[0.6, 0x009383],
[0.65, 0x008a85],
[0.7, 0x008186],
[0.75, 0x007788],
[0.8, 0x006d8a],
[0.85, 0x00618c],
[0.9, 0x00558d],
[0.95, 0x00478f],
[1.0, 0x003492],
];
updateColormap(vmin, vmax);
const visualizer = new ColorRampVisualizer(cmap);
function evaluatePixel(sample) {
let scaleFactor = 1000;
let val = sample.SWC / scaleFactor;
let imgVals = visualizer.process(val);
return {
default: [...imgVals, sample.dataMask],
index: [val],
eobrowserStats: [val],
dataMask: [sample.dataMask],
};
}//VERSION=3
function setup() {
return {
input: ["SWC"],
output: { bands: 4 },
};
}
function evaluatePixel(sample) {
let scaleFactor = 1000;
let val = sample.SWC / scaleFactor;
return [val];
}Evaluate and visualize
As Soil Water Content is commercial data, brought into Sentinel Hub as Bring Your Own Data, direct EO Browser links are not possible due to the personalized data credentials.
General description
Soil Water Content (SWC) measures the amount of water in a unit volume of soil, which is crucial information for drought monitoring, water management, and climate risk assessment.
Planet’s SWC product provides near-daily measurements at spatial resolutions of 100 m and 1000 m. It is unhindered by clouds and has a long and consistent data record of more than 20 years. Please check here for a list of available bands.
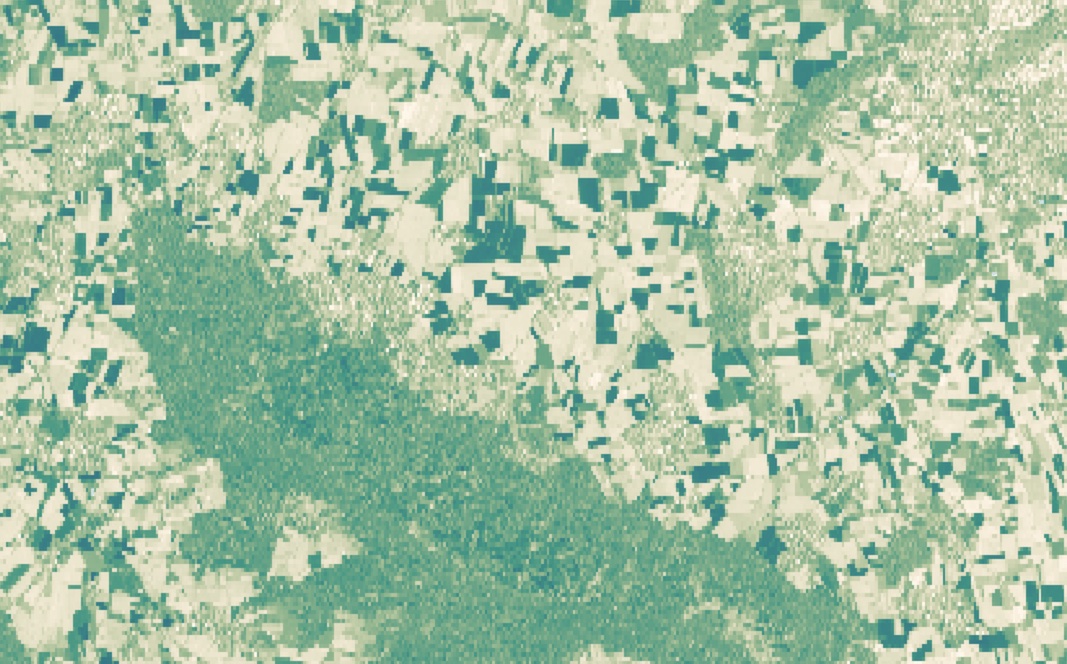
Description of representative images
Soil Water Content (L band 100 m) on Sep 30th, 2023 near Hanover, Germany.