Soil Moisture Estimation Script
//VERSION=3 (auto-converted from 1)

/*

Surface Soil Moisture (SSM) retrieval using change detection approach.

Author Details:
Narayana Rao B.
206-MRSLab, CSRE,
IIT Bombay, India.

A detailed explanation of the implemented algorithm can be found in the following articles.

Wagner, W., Lemoine, G., Borgeaud, M. and Rott, H., 1999.
A study of vegetation cover effects on ERS scatterometer data.
IEEE Transactions on Geoscience and Remote Sensing, 37(2), pp.938-948.

B. Bauer-Marschallinger et al.,
"Toward Global Soil Moisture Monitoring With Sentinel-1: Harnessing Assets and Overcoming Obstacles,"
in IEEE Transactions on Geoscience and Remote Sensing, vol. 57, no. 1, pp. 520-539, Jan. 2019.

*/

function setup() {
    return {
        input: [
            {
                bands: ["VV", "VH"],
            },
        ],
        output: { bands: 3 },
        mosaicking: "ORBIT",
    };
}

function preProcessScenes(collections) {
    collections.scenes.orbits = collections.scenes.orbits.filter(function (
        orbit
    ) {
        var orbitDateFrom = new Date(orbit.dateFrom);
        return (
            orbitDateFrom.getTime() >=
            collections.to.getTime() - 36 * 30 * 24 * 3600 * 1000
        ); // Data from 36 months to current date

    });
    return collections;
}

function evaluatePixel(samples, scenes) {
    var count = 0;
    var Mv = 0;
    var max = 0;
    var min = 2.0;
    var sum_VV = 0;

    for (var i = 0; i < samples.length - 1; i++) {
        max = samples[i].VV > max ? samples[i].VV : max; // Calculating all time maximum--Wet index

        min = samples[i].VV < min ? samples[i].VV : min; // Calculating all time minimum--Dry index

        sum_VV += samples[i].VV;
        count++;
    }
    // Overall range of intensity values Anologous to 0-100% soil moisture

    var sensitivity = max - min;
    // If overall averge is more than 6dB i.e., High intensity always usually urban areas.

    // Generating urban area mask using -6dB threshold

    urban_mask = 10 * Math.log10(sum_VV / count) > -6 ? 0 : 1;
    // If overall averge is less than 17dB i.e., low intensity always usually water bodies.

    // Generating permanent water body mask using -17dB threshold

    water_mask = 10 * Math.log10(sum_VV / count) < -17 ? 0 : 1;
    // Assuming change in bckscatter intensity only because of change in soil moisture.

    Mv = (samples[0].VV - min) / sensitivity;
    Mv = Mv * water_mask * urban_mask; // Applying urban and permanent water body mask


    /*

    Assigning colormap for enhanced visualisation

    */
    var v = Mv;
    var vmin = 0;
    var vmax = 0.6;
    var diffv = vmax - vmin;

    var r = 0.0;
    var g = 0.0;
    var b = 0.0;

    if (v < vmin) {
        v = vmin;
    }
    if (v > vmax) {
        v = vmax;
    }
    //Threshold values for colorMap

    var T1 = 0.1;
    var T2 = 0.3;
    var T3 = 0.4;
    var T4 = 0.5;

    var Thresh_1 = vmin + T1 * diffv;
    var Thresh_2 = vmin + T2 * diffv;
    var Thresh_3 = vmin + T3 * diffv;
    var Thresh_4 = vmin + T4 * diffv;

    if (v <= 0) {
        r = 1;
        g = 1;
        b = 1;
    } else if (v < Thresh_1) {
        r = 0.5 + (v - vmin) / (Thresh_1 - vmin) / 2;
    } else if (v < Thresh_2) {
        r = 1;
        g = (v - Thresh_1) / (Thresh_2 - Thresh_1);
        b = 0;
    } else if (v < Thresh_3) {
        r = 1 + (Thresh_2 - v) / (Thresh_3 - Thresh_2);
        g = 1;
        b = (v - Thresh_2) / (Thresh_3 - Thresh_2);
    } else if (v < Thresh_4) {
        r = 0;
        g = 1 + (Thresh_3 - v) / (Thresh_4 - Thresh_3);
        b = 1;
    } else {
        b = 1.0 + (Thresh_4 - v) / (vmax - Thresh_4) / 2;
    }
    return [r, g, b];
}Evaluate and Visualize
General description of the script
Script estimates surface soil moisture using change detection algorithm (TU Wien Change Detection model). The algorithm relates the change in backscatter intensity to the change in moisture. This relative change in soil moisture converted to absolute soil moisture by attributing the lowest and highest backscatter values to 0% and 100 % soil moisture respectively for a given pixel. To avoid the effect of outliers in caculating sensitivity of back scatter intensity (max-min), extreme 10% range on both sides was trimmed. This script produces soil moisture ranges from 0 to 60% with colour representation of red being 0 and blue as 60%. White colour represents the masked out area. Permanent water bodies and urban areas are masked out using backscatter intensity thresholds to minimise the number of false pixels. This masking approach is robust since it utilises long time series data.
Details of the script
The script to estimate surface soil moisture using change detection approach can be applied globally. Since we are considering 3-year data in calculating the sensitivity of backscatter fluctuations, it is resistant to seasonal fluctuations. It is capable of masking urban and permanent water bodies to reduce false results. The script can produce reasonably good results in flat and moderate slope terrains. But in high slope regions, the incidence angle effect on backscatter intensity affect the results. Rough water surfaces result in false results, e.g. oceans, but not always. Few developing urban areas may also produce false results.
For more details on the script see supplementary material.
Author of the script
Narayana Rao Bhogapurapu
Description of representative images
Resulted soil moisture is applied with jet color map for better interpretation. Red color represents low soil moisture (dry soil-0%) whereas blue represents high soil moisture (wet soil-60%). Permanent water bodies and built-up areas are masked out with white color.
Malinong, Australia 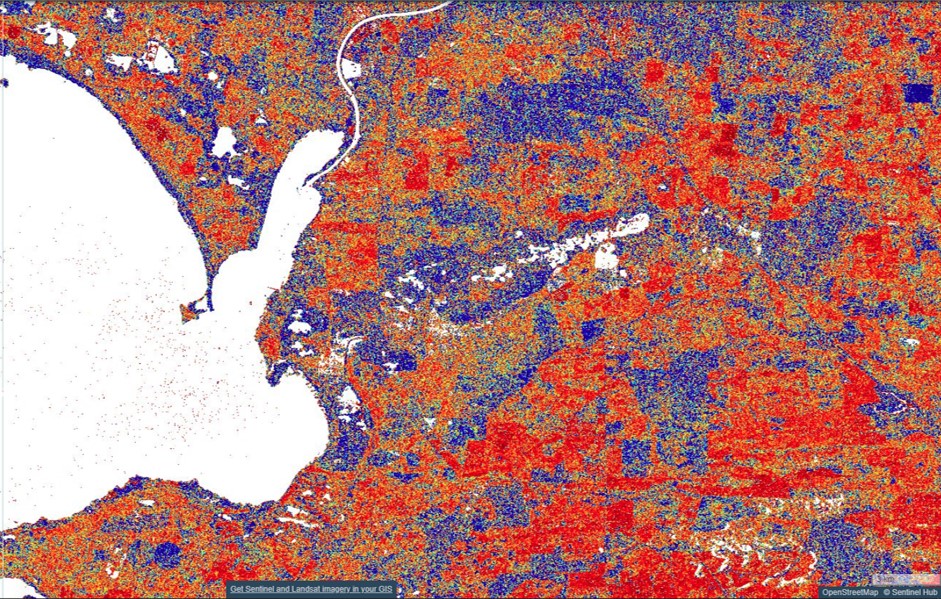
Manitoba, Canada 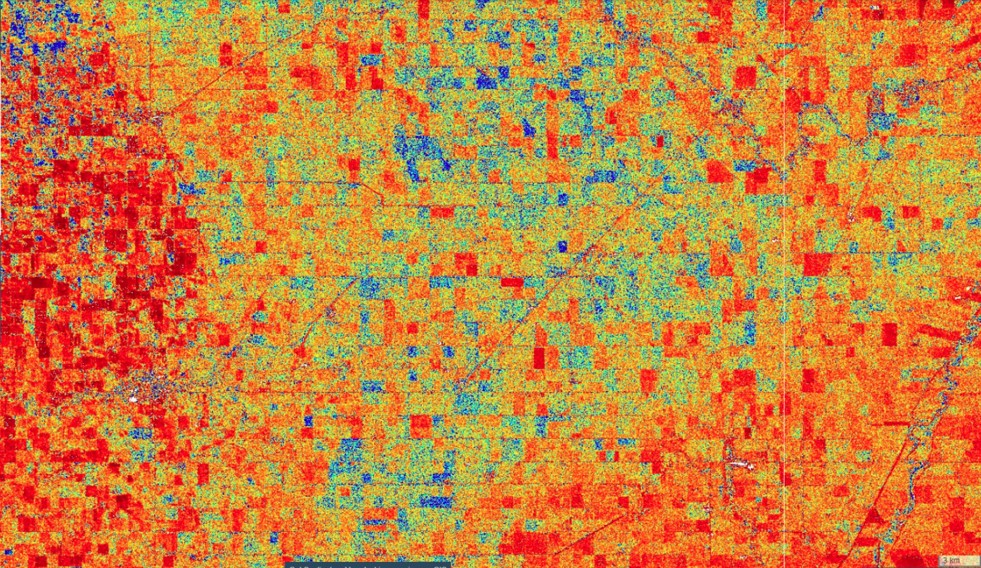
Marrakech, Marocco 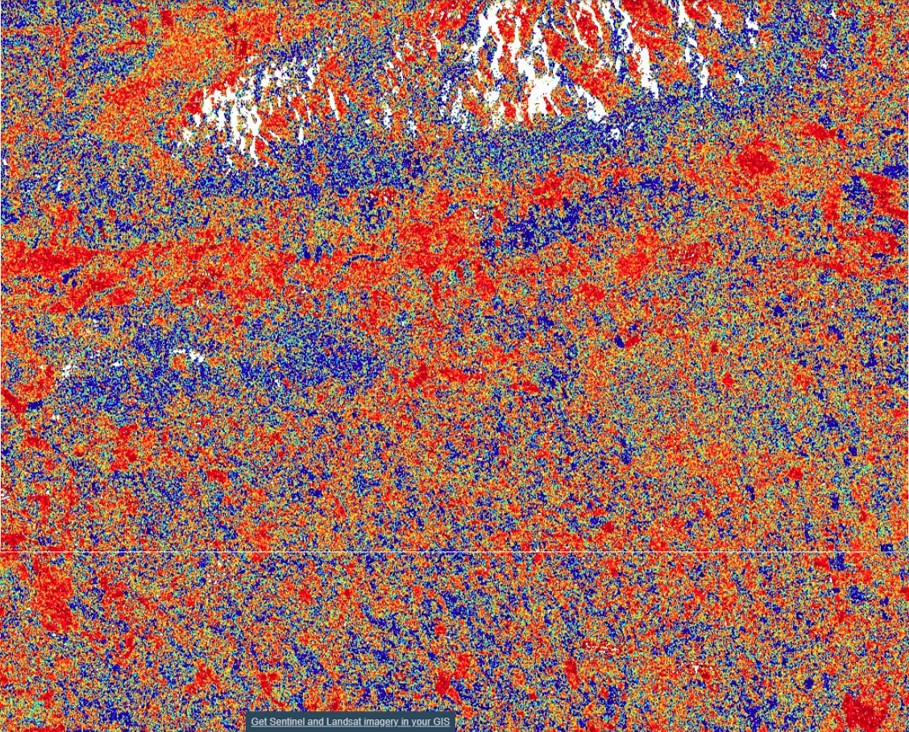
Sevilla, Spain 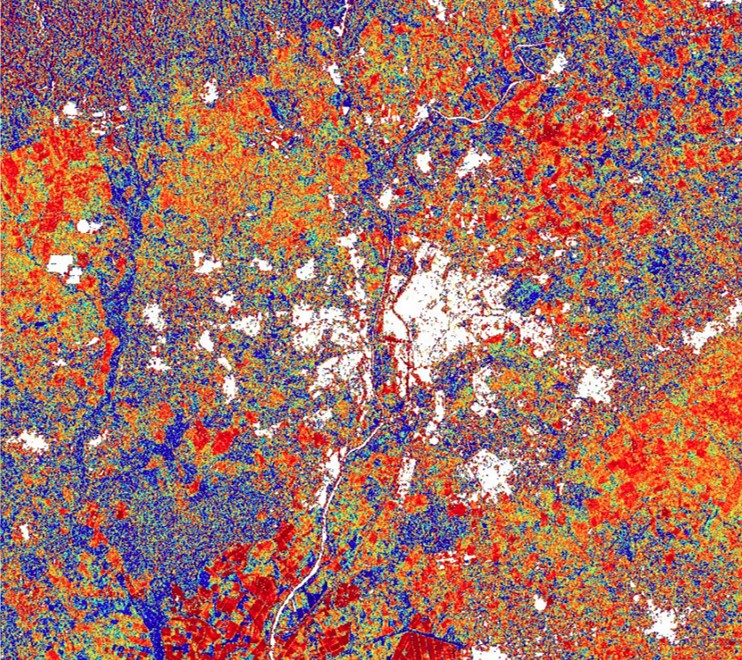
Vijayawada, India 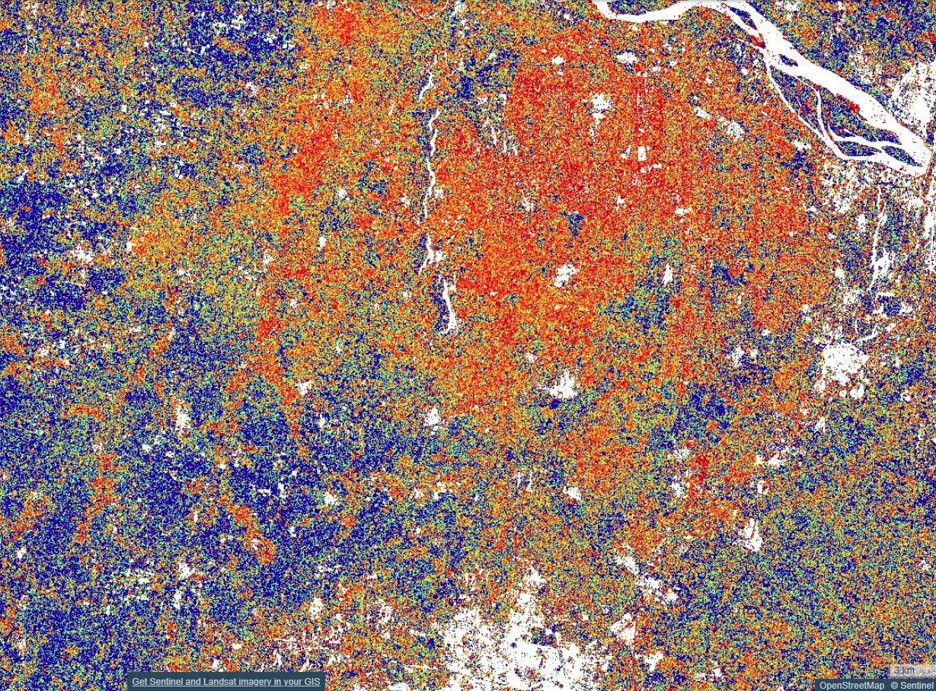
References
[1] Wagner, W., Lemoine, G., Borgeaud, M. and Rott, H., 1999. A study of vegetation cover effects on ERS scatterometer data. IEEE Transactions on Geoscience and Remote Sensing, 37(2), pp.938-948.
[2] B. Bauer-Marschallinger et al., “Toward Global Soil Moisture Monitoring With Sentinel-1: Harnessing Assets and Overcoming Obstacles,” in IEEE Transactions on Geoscience and Remote Sensing, vol. 57, no. 1, pp. 520-539, Jan. 2019.
Credits
-
Wagner, W., Lemoine, G., Borgeaud, M. and Rott, H., 1999. A study of vegetation cover effects on ERS scatterometer data. IEEE Transactions on Geoscience and Remote Sensing, 37(2), pp.938-948.
-
B. Bauer-Marschallinger et al., “Toward Global Soil Moisture Monitoring With Sentinel-1: Harnessing Assets and Overcoming Obstacles,” in IEEE Transactions on Geoscience and Remote Sensing, vol. 57, no. 1, pp. 520-539, Jan. 2019.