Forest Cut Temporal Detection Script
//VERSION=3 (auto-converted from 1)
// Minimum difference between the two mean NDVIs
var thresold = 0.25;
// Thresold to dismiss clouds to calculate the mean
var blueThresold = 0.18;
// Minimum mean NDVI to consider for month(s) of last year
var minimunNDVI = 0.7;
// to normalize colormap
var stretchMin = 0;
var stretchMax = 0.8;

function setup() {
  return {
    input: [{
      bands: [
          "B02",
          "B03",
          "B04",
          "B05",
          "B08",
          "B12"
      ]
    }],
    output: { bands: 3 },
    mosaicking: "ORBIT"
  }
}


function stretch(val, min, max) {
    return (val - min) / (max - min);
}


function NDVI(sample) {
    let denom = sample.B08 + sample.B04;
    return ((denom != 0) ? (sample.B08 - sample.B04) / denom : 0.0);
}

function NDWI(sample) {
    let denom = sample.B03 + sample.B08;
    return ((denom != 0) ? (sample.B03 - sample.B08) / denom : -1);
}

function mean(array) {
    if (array.length == 0) {
        return 1
    } else {
        var sum = 0;
        for (var i = 0; i < array.length; i++) {
            sum += parseFloat(array[i]); //don't forget to add the base
        }

        var avg = sum / array.length;
        return avg
    }
}

// Manage overlapping years.
// If january is selected and user need 2 months to take
// script needs to take december from last year as second month.
function getNeededDates(sceneMonth, sceneYear, monthsToTake) {
    let monthToGet = [];
    let yearToGet = [];

    for (i = 0; i < monthsToTake; i++) {
        if (sceneMonth - i <= 0) {
            month = 12 - (sceneMonth - i);
            year = sceneYear - 1;
        } else {
            month = sceneMonth - i;
            year = sceneYear;
        }
        monthToGet.push(month);
        yearToGet.push(year);
    }

    return [monthToGet, yearToGet];
}

function evaluatePixel(samples, scenes) {
    let initMonth = scenes[0].date.getMonth();
    let initYear = scenes[0].date.getFullYear();

    let monthsAndYears = getNeededDates(initMonth, initYear, 3);

    let currentYearNDVI = 0;
    let currentYearCount = 0;

    let previousYearNDVI = 0;
    let previousYearCount = 0;
    let lastYearMonth0 = [];
    let lastYearMonth1 = [];
    let lastYearMonth2 = [];

    for (i = 0; i < samples.length; i++) {
        if (!(samples[i].B04 == 0) & !(samples[i].B03 == 0)) {
            sceneMonth = scenes[i].date.getMonth();
            sceneYear = scenes[i].date.getFullYear();
            if (monthsAndYears[0].includes(sceneMonth)) {
                if (samples[i].B02 < blueThresold) {
                    ndvi = NDVI(samples[i]);
                    if (monthsAndYears[1].includes(sceneYear))
                    // if current year (last 12 months max)
                    {
                        currentYearNDVI = currentYearNDVI + ndvi;
                        currentYearCount++;

                    }
                    // if year before
                    else if (monthsAndYears[1].includes(sceneYear + 1)) {
                        previousYearNDVI = previousYearNDVI + ndvi;

                        if (monthsAndYears[0][0] == sceneMonth) {
                            lastYearMonth0.push(ndvi);
                        } else if (monthsAndYears[0][1] == sceneMonth) {
                            lastYearMonth1.push(ndvi);
                        } else if (monthsAndYears[0][2] == sceneMonth) {
                            lastYearMonth2.push(ndvi);
                        }
                        previousYearCount++;
                    }
                }
            }
        }
    }

    // compute the mean
    let avgCurrentYearNDVI = currentYearNDVI / currentYearCount;
    let avgPreviousYearNDVI = previousYearNDVI / previousYearCount;

    // if ndvi decreases from defined thresold in the same months from previous year
    // highlights in red the pixel
    // check also if is not water
    let difference = avgPreviousYearNDVI - avgCurrentYearNDVI;

    if ((NDWI(samples[0]) < 0.5) & (difference >= thresold) & (avgPreviousYearNDVI > minimunNDVI) & (mean(lastYearMonth0) > minimunNDVI) & (mean(lastYearMonth1) > minimunNDVI) & (mean(lastYearMonth2) > minimunNDVI)) {
        // the more the difference is high, the more it is red
        colorMap = [stretch((2.8 * (2 / 3) * 10 * difference * samples[0].B04 + 0.1 * samples[0].B05), stretchMin, stretchMax), stretch((2.8 * samples[0].B03 + 0.15 * samples[0].B08), stretchMin, stretchMax), stretch((2.8 * samples[0].B02), stretchMin, stretchMax)];
    }
    // else show current image
    else {
        colorMap = [stretch((2.8 * samples[0].B04 + 0.1 * samples[0].B05), stretchMin, stretchMax), stretch((2.8 * samples[0].B03 + 0.15 * samples[0].B08), stretchMin, stretchMax), stretch((2.8 * samples[0].B02), stretchMin, stretchMax)];
    }
    return colorMap;
}

function preProcessScenes (collections) {
    collections.scenes.orbits = collections.scenes.orbits.filter(function (orbit) {
        var orbitDateFrom = new Date(orbit.dateFrom)
        return orbitDateFrom.getTime() >= (collections.to.getTime()-(14 * 31 * 24 * 3600 * 1000)); // 14 = 11 months + 3 months
    })
    return collections
}Evaluate and Visualize
General description of the script
Forests are essential for wildlife, biodiversity and to fight climate change.
In order to map forest cutting from one year to another, this script compares:
- the mean ndvi of the three previous months from the selected image
- to the mean ndvi of the three same months but from the previous year
If the NDVI decreases above 0.25, it is certainly a clear cut.
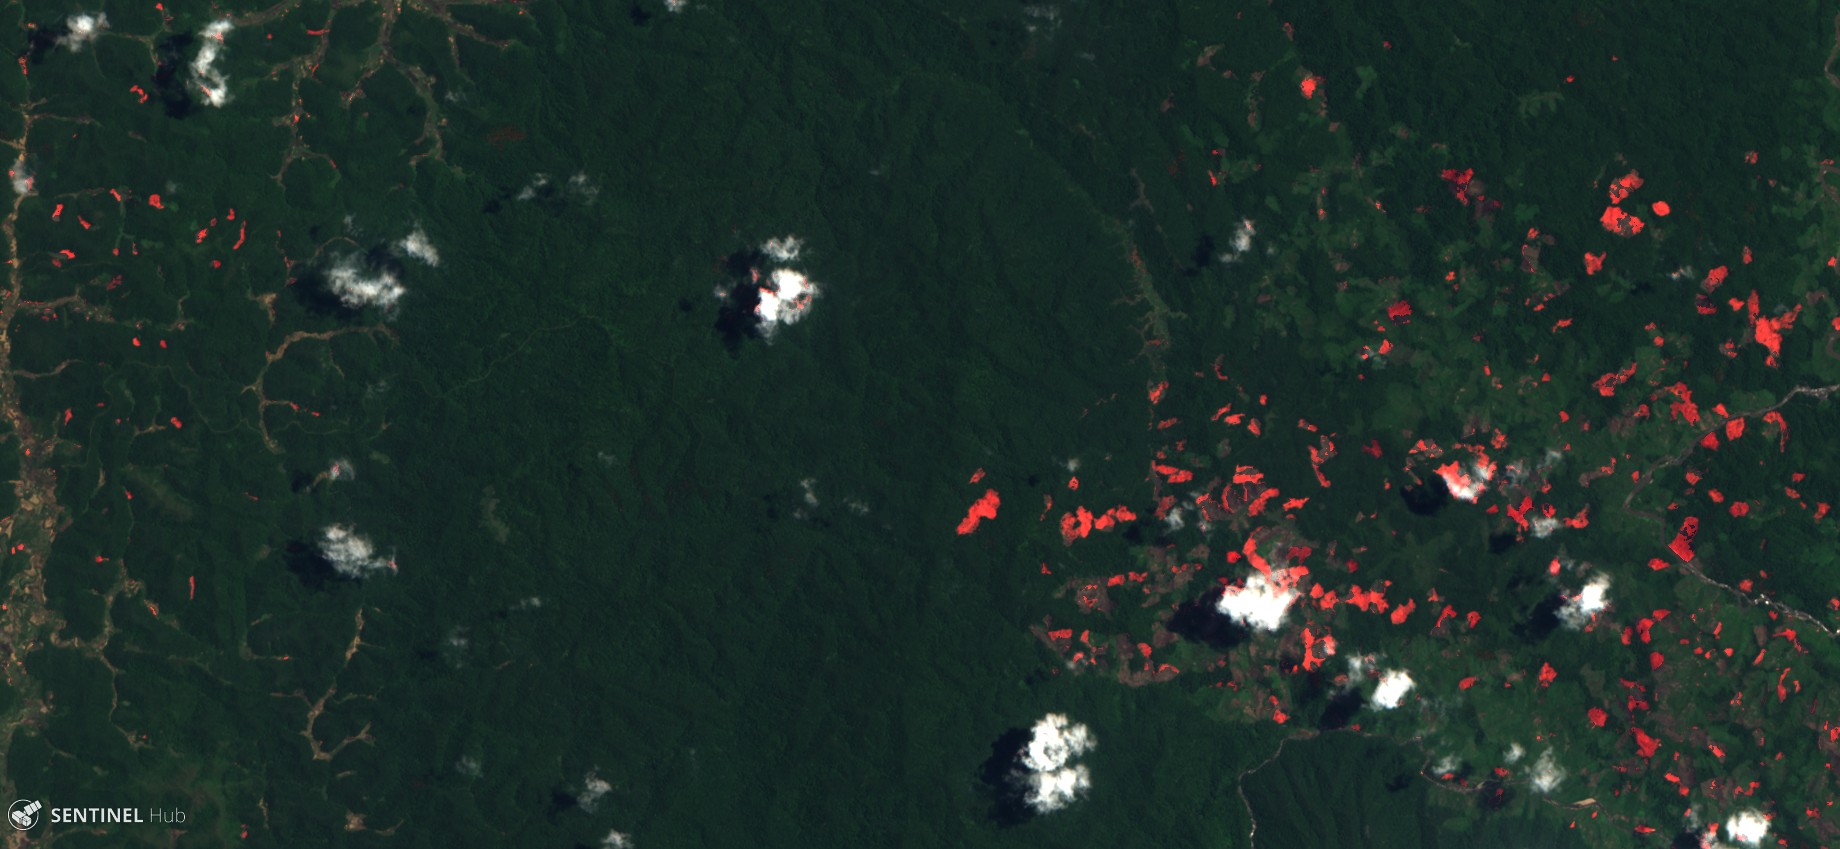
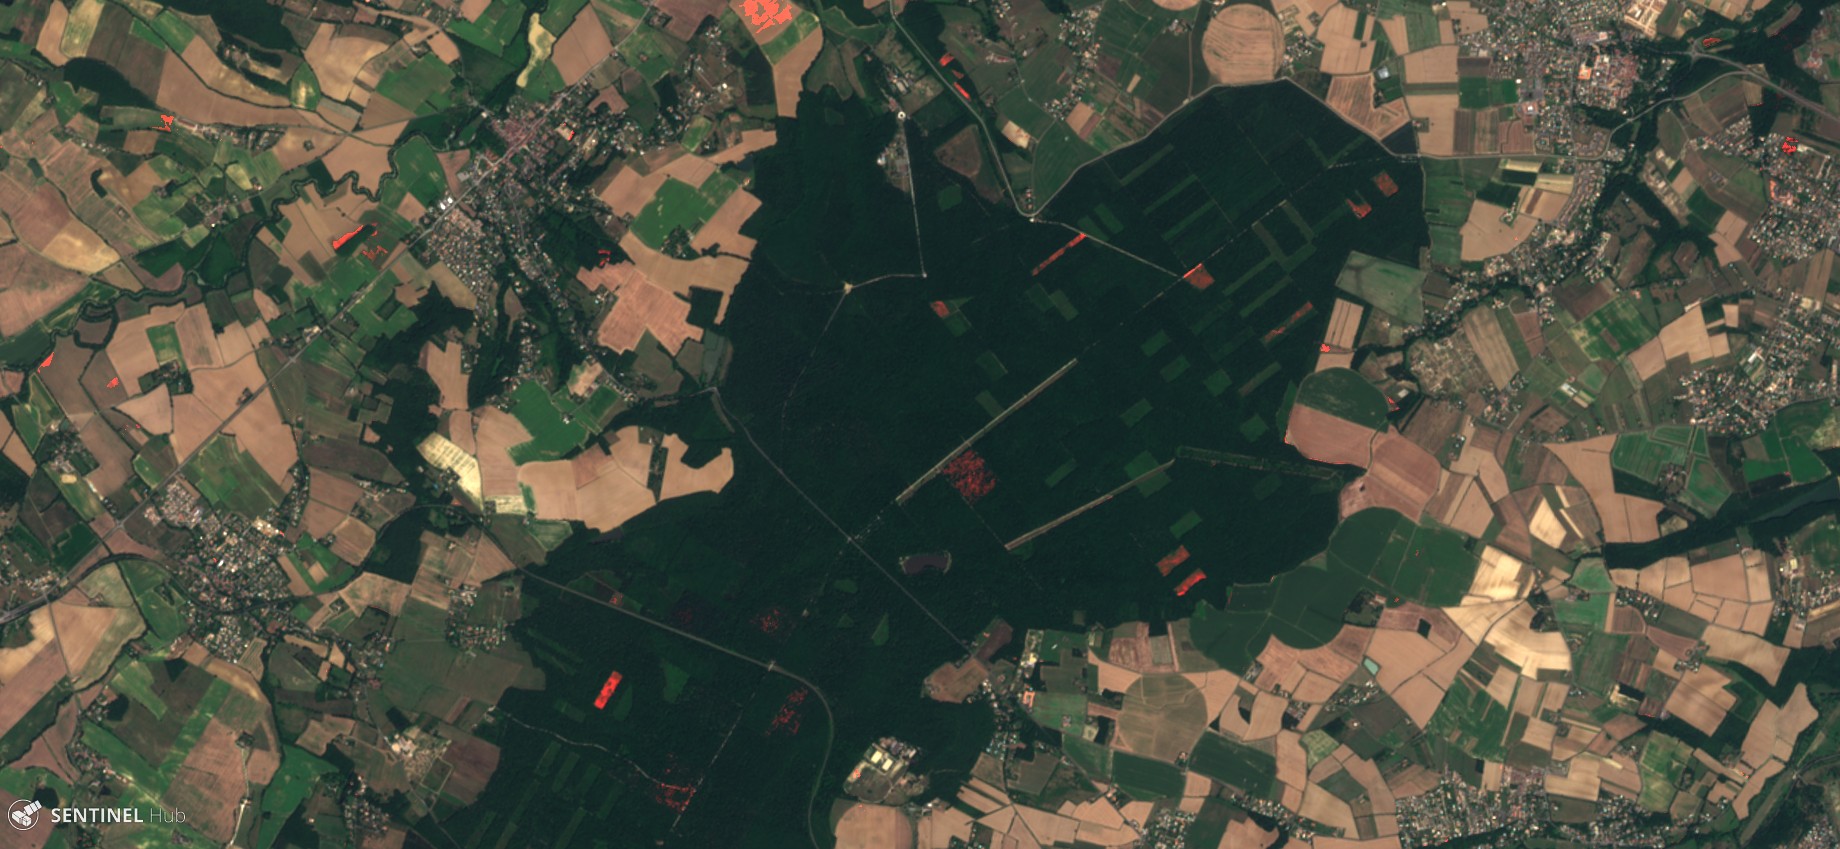
As the aim of the script is to represent the forest cutting, it will color in red the pixel where cuts have been detected.
The limitations are essentially:
- can’t work if no unclouded pixel is available in the last three months
- forest can be confused with crops (it is best to know it was forest previous year)
- cuts can be confused with later phenology (e.g. drought)
Author of the script
Karasiak Nicolas
Description of representative images
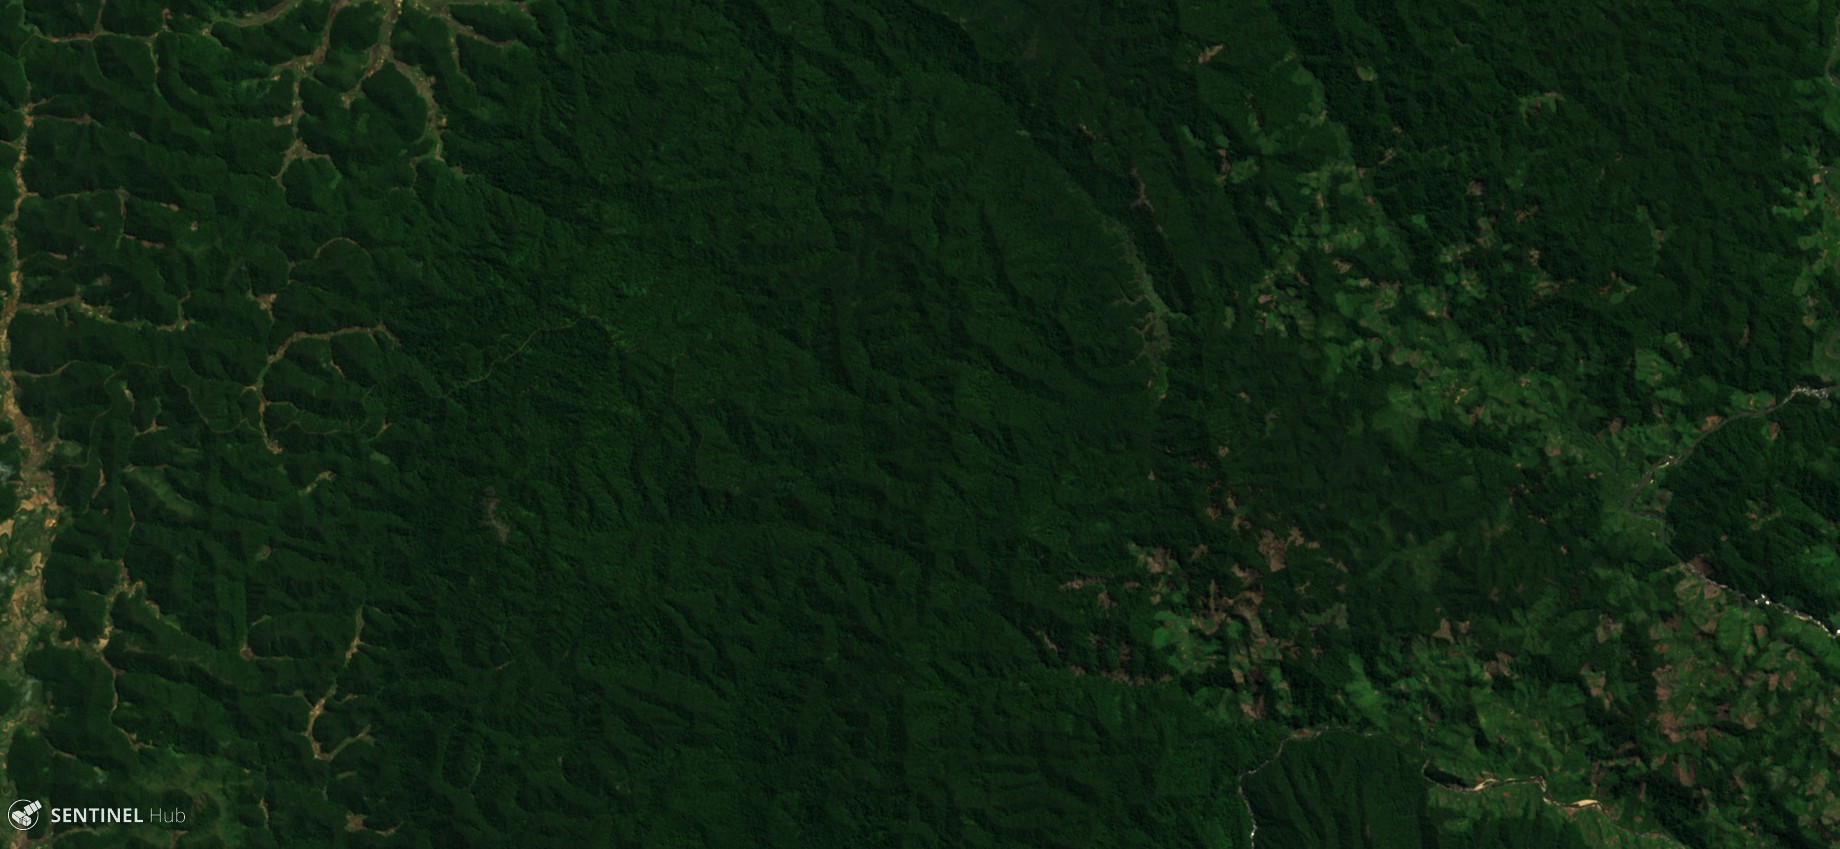
The two images are from Madagascar forest. The first one represent the forest in 2017 (raw image from S2 L2A). The second is from 2018 and the script highlights in red where forest clear cuttings have been made.
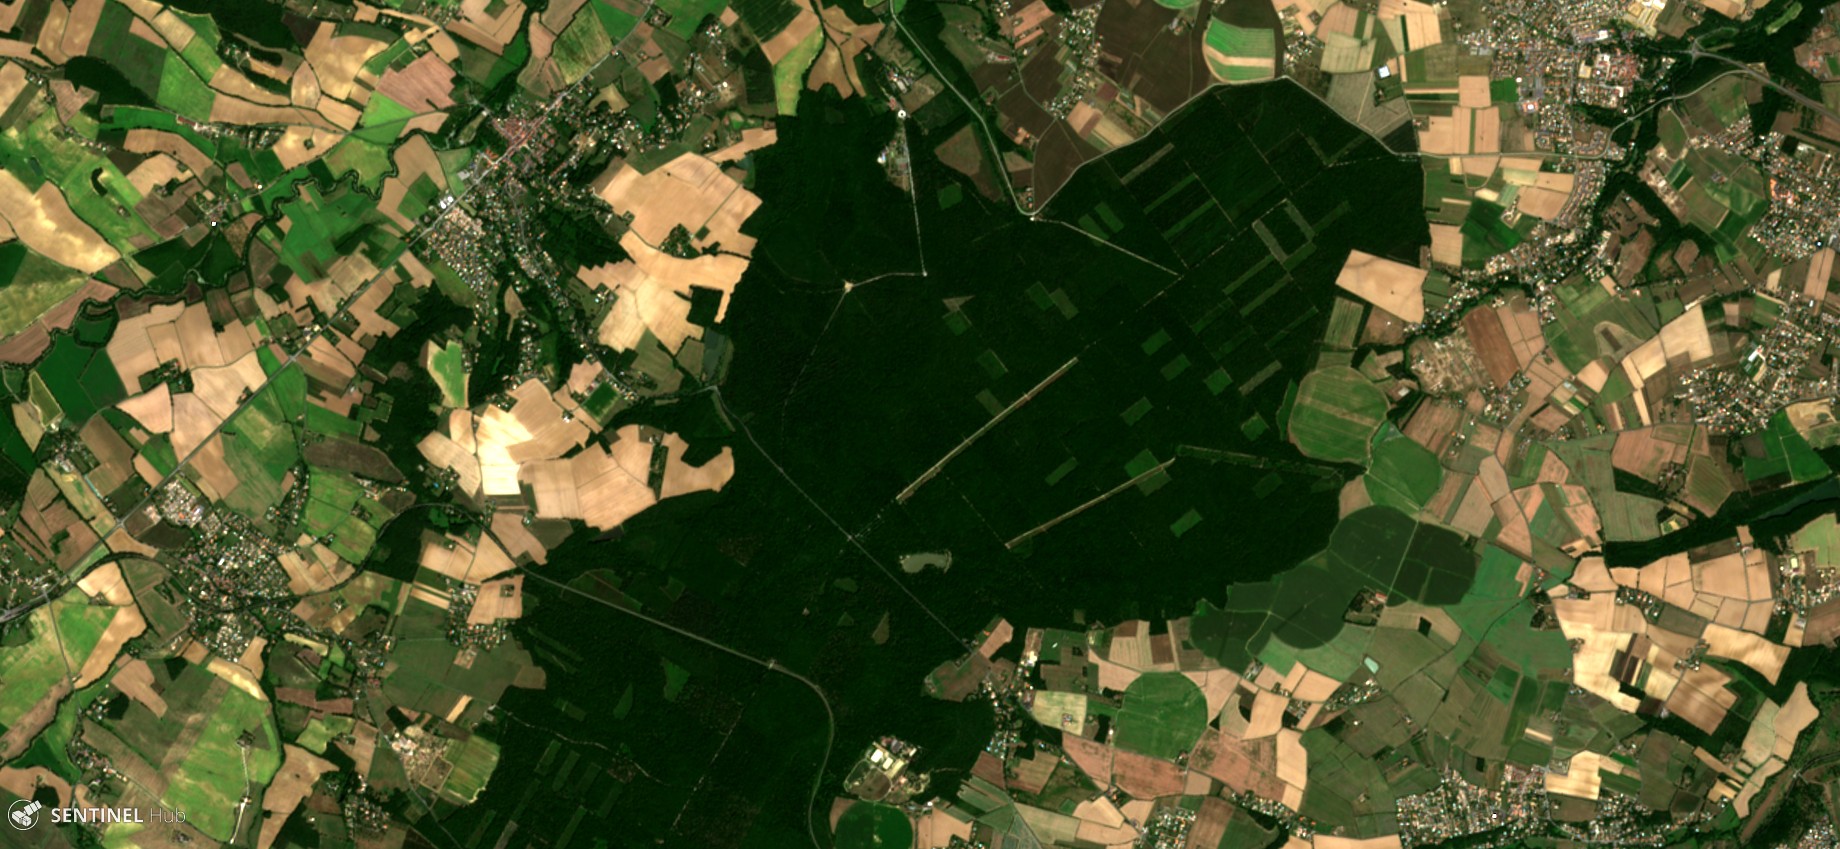
The third and the fourth images are the same things for Bouconne forest in France (near Toulouse).


More information is available in the supplementary material.
Credits
Inspired by Harel Dan temporal script