Vegetation Productivity Indicator
//VERSION=3
function setup() {
    return {
        input: ["B04", "B08", "CLM", "dataMask"],
        output: { bands: 1 },
        mosaicking: "ORBIT",
    };
}

const NODATA = -32768;

// tolerance in either direction, so i.e. +- 5 days
const toleranceDays = 5;
const msInDay = 24 * 60 * 60 * 1000;
const msInYear = 365.25 * msInDay;
const msInHalfYear = msInYear / 2;
const toleranceMs = toleranceDays * msInDay;

var metadata = undefined;

function relDiff(a, b) {
    const diff = Math.abs(a - b);
    return diff > msInHalfYear ? msInYear - diff : diff;
}

function datetimeToYearEpoch(date) {
    return date - new Date(Date.UTC(date.getUTCFullYear(), 0, 1));
}

function sortDatesDescending(d1, d2) {
    const date1 = new Date(d1.dateFrom);
    const date2 = new Date(d2.dateFrom);
    return date2 - date1;
}

function preProcessScenes(collections) {
    // sort
    let scenes = collections.scenes.orbits;
    scenes = scenes.sort(sortDatesDescending);
    let newScenes = [];
    // convert first scene to day of year
    const observed = new Date(scenes[0].dateFrom);
    const obsMs = datetimeToYearEpoch(observed);
    for (let i = 0; i < scenes.length; i++) {
        let currentDate = new Date(scenes[i].dateFrom);
        let sceneMs = datetimeToYearEpoch(currentDate);
        let dt = relDiff(obsMs, sceneMs);
        if (dt <= toleranceMs) {
            newScenes.push(scenes[i]);
        }
    }

    metadata = {
        observed: observed.toISOString(),
        historical: newScenes.slice(1).map((scene) => scene.dateFrom),
    };

    collections.scenes.orbits = newScenes;
    return collections;
}

function updateOutputMetadata(scenes, inputMetadata, outputMetadata) {
    outputMetadata.userData = metadata;
}

function percentileOfScore(data, value) {
    // Calculate the percentile rank of a value relative to a list of values.

    data.sort((a, b) => a - b);

    let lowerCount = 0;
    let sameCount = 0;

    for (let i = 0; i < data.length; i++) {
        if (data[i] < value) {
            lowerCount++;
        } else if (data[i] === value) {
            sameCount++;
        } else {
            break;
        }
    }

    return ((lowerCount + 0.5 * sameCount) / data.length) * 100;
}

function updateOutputMetadata(scenes, inputMetadata, outputMetadata) {
    outputMetadata.userData = metadata;
}

function isClear(sample) {
    return sample.CLM == 0 && sample.dataMask == 1;
}

function evaluatePixel(samples) {
    // if the first value isn't clear, stop
    if (!isClear(samples[0])) {
        return [NODATA];
    }
    const clearTs = samples.filter(isClear);
    let vpi = NODATA;
    if (clearTs.length > 1) {
        const observed = index(clearTs[0].B08, clearTs[0].B04);
        var hist_ndvi = [];
        for (let i = 1; i < clearTs.length; i++) {
            const ndvi = index(clearTs[i].B08, clearTs[i].B04);
            hist_ndvi.push(ndvi);
        }
        vpi = percentileOfScore(hist_ndvi, observed) / 100;
    }

    return [vpi];
}Evaluate and Visualize
General description of the script
The vegetation productivity indicator (VPI) assesses the overall vegetation condition by comparing the observed NDVI to a cumulative probability plot of the long-term statistics for the same 10-day period [1]. VPI is a per-pixel and per decade percentile ranking of the observed NDVI value against its historical range of variability and reflects the probability of observing a similar NDVI value in the entire time series. Low VPI values indicate that the actual observation corresponds to the historical minimum (worst vegetation state), whereas high values correspond to the historical maximum (best situation).
Please note that in case of Sentinel 2, only a few years of history are available.
The script takes the newest (latest) available scene as the observed one. Then, for each previous year the script finds all values within toleranceDays of the most recent date.
The actual scenes (dates) used can be returned as meta-data with an API requests by replacing the responses part of the request with:
  "responses":  [{
    "identifier": "userdata",
    "format": { "type": "application/json" }
  }]
Example response:
{
  "historical":[
    "2019-05-31T00:00:00.000Z",
    "2018-05-31T00:00:00.000Z",
    "2017-05-26T00:00:00.000Z",
    "2016-06-07T00:00:00.000Z"
    ],
  "observed":"2020-05-30T00:00:00.000Z"
}
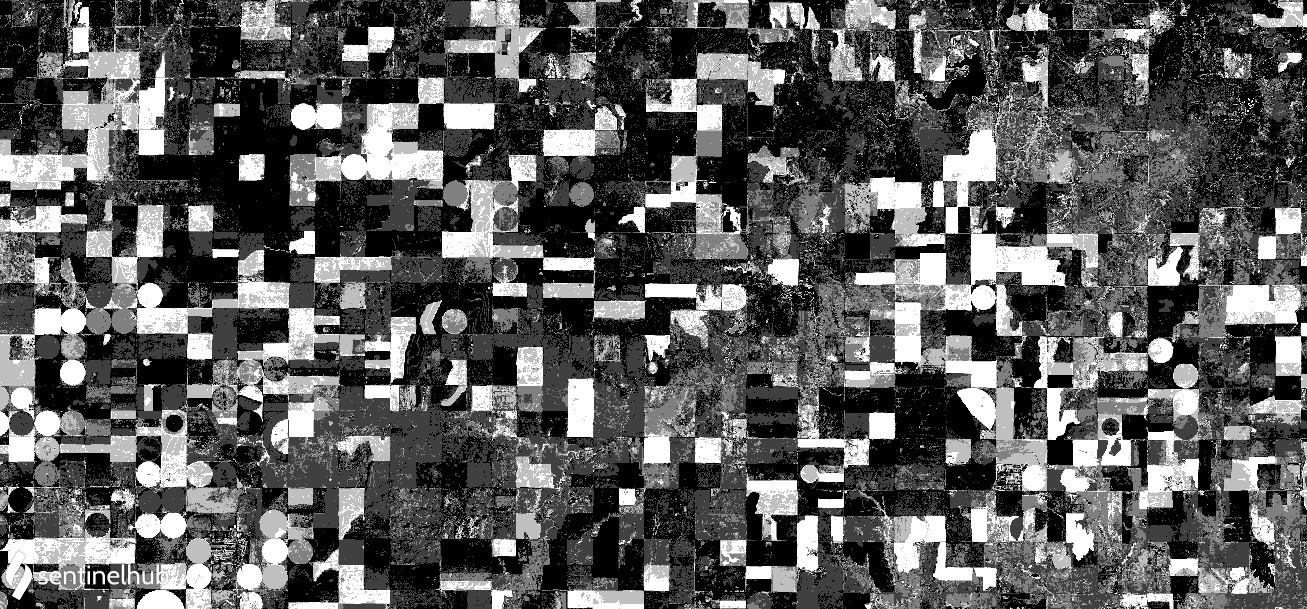
Description of representative images
Vegetation productivity indicator near Dodge City, Kansas, USA. Acquired on 30.05.2020.
References
[1] C. A. D. Sannier, J. C. Taylor, W. Du Plessis & K. Campbell (1998) Real-time vegetation monitoring with NOAA-AVHRR in Southern Africa for wildlife management and food security assessment, International Journal of Remote Sensing, 19:4, 621-639, DOI: 10.1080/014311698215892