Sentinel-3 Land Surface Temperature Mapping
// VERSION 3

/**
  This script is directly based on the Landsat-8 Land Surface Temperature Mapping script by Mohor Gartner
  https://custom-scripts.sentinel-hub.com/landsat-8/land_surface_temperature_mapping/
  since the script uses Landsat TIRS B10 for brightness temperature
  mapping and Landsat OLI NDVI to scale for emissivity, this can be followed using
  Sentinel-3 SLSTR S08 and Sentinel-3 OLCI NDVI

  in order to use this script you have to enable "use additional datasets (advanced)"
  and set S-3 OLCI and S-3 SLSTR as the primary and additional dataset.

  Aliases should be
   - Sentinel-3 OLCI=S3OLCI
   - Sentinel-3 SLSTR=S3SLSTR

  STARTING OPTIONS
  for analysis of one image (EO Browser), choose option=0. In case of MULTI-TEMPORAL analyis,
  option values are following:
  0 - outputs average LST in selected timeline (% of cloud coverage should be low, e.g. < 10%)
  1 - outputs maximum LST in selected timeline (% of cloud coverage can be high)
  2 - THIS OPTION IS CURRENTLY NOT FUNCTIONAL - outputs standard deviation LST in selected timeline;
      minTemp and highTemp are overwritten with values 0 and 10 (% of cloud coverage should be low, e.g. < 5%)
*/
var option = 0;

// minimum and maximum values for output colour chart red to white for temperature in °C. Option 2 overwrites this selection!
var minC = 0;
var maxC = 50;

////INPUT DATA - FOR BETTER RESULTS, THE DATA SHOULD BE ADJUSTED
// NVDIs for bare soil and NDVIv for full vegetation
// Note: NVDIs for bare soil and NDVIv for full vegetation are needed to
//       be evaluated for every scene. However in the custom script, default values are set regarding:
// https://profhorn.meteor.wisc.edu/wxwise/satmet/lesson3/ndvi.html
// https://www.researchgate.net/post/Can_anyone_help_me_to_define_a_range_of_NDVI_value_to_extract_bare_soil_pixels_for_Landsat_TM
// NVDIs=0.2, NDVIv=0.8
// other source suggests global values: NVDIs=0.2, NDVIv=0.5;
// https://www.researchgate.net/publication/296414003_Algorithm_for_Automated_Mapping_of_Land_Surface_Temperature_Using_LANDSAT_8_Satellite_Data
var NDVIs = 0.2;
var NDVIv = 0.8;

// emissivity
var waterE = 0.991;
var soilE = 0.966;
var vegetationE = 0.973;
//var buildingE=0.962;
var C = 0.009; //surface roughness, https://www.researchgate.net/publication/331047755_Land_Surface_Temperature_Retrieval_from_LANDSAT-8_Thermal_Infrared_Sensor_Data_and_Validation_with_Infrared_Thermometer_Camera

//central/mean wavelength in meters, Sentinel-3 SLSTR B08 (almost the same as Landsat B10)
var bCent = 0.000010854;

// rho =h*c/sigma=PlanckC*velocityLight/BoltzmannC
var rho = 0.01438; // m K

//// visualization
// if result should be std dev (option=2), overwrite minMaxC.
if (option == 2) {
  minC = 0;
  maxC = 25;
}
let viz = ColorRampVisualizer.createRedTemperature(minC, maxC);

//this is where you set up the evalscript to access the bands of the two datasets in the fusion

function setup() {
  return {
    input: [
      { datasource: "S3SLSTR", bands: ["S8"] },
      { datasource: "S3OLCI", bands: ["B06", "B08", "B17"] },
    ],
    output: [{ id: "default", bands: 3, sampleType: SampleType.AUTO }],
    mosaicking: "ORBIT",
  };
}

//emissivity calc (Unchanged from Landsat script)
//https://www.researchgate.net/publication/296414003_Algorithm_for_Automated_Mapping_of_Land_Surface_Temperature_Using_LANDSAT_8_Satellite_Data
//https://www.academia.edu/27239873/Investigating_Land_Surface_Temperature_Changes_Using_Landsat_Data_in_Konya_Turkey
function LSEcalc(NDVI, Pv) {
  var LSE;
  if (NDVI < 0) {
    //water
    LSE = waterE;
  } else if (NDVI < NDVIs) {
    //soil
    LSE = soilE;
  } else if (NDVI > NDVIv) {
    //vegetation
    LSE = vegetationE;
  } else {
    //mixtures of vegetation and soil
    LSE = vegetationE * Pv + soilE * (1 - Pv) + C;
  }
  return LSE;
}

function evaluatePixel(samples) {
  // starting values max, avg, stdev, reduce N, N for multi-temporal
  var LSTmax = -999;
  var LSTavg = 0;
  var LSTstd = 0;
  var reduceNavg = 0;
  var N = samples.S3SLSTR.length;

  //to caputure all values of one pixel for for whole timeline in mosaic order
  var LSTarray = [];

  // multi-temporal: loop all samples in selected timeline
  for (let i = 0; i < N; i++) {
    //// for LST S8
    var Bi = samples.S3SLSTR[i].S8;
    var B06i = samples.S3OLCI[i].B06;
    var B08i = samples.S3OLCI[i].B08;
    var B17i = samples.S3OLCI[i].B17;

    // some images have errors, whole area is either B10<173K or B10>65000K. Also errors, where B06 and B17 =0. Therefore no processing if that happens, in addition for average and stdev calc, N has to be reduced!
    if (Bi > 173 && Bi < 65000 && B06i > 0 && B08i > 0 && B17i > 0) {
      // ok image
      //1 Kelvin to C
      var S8BTi = Bi - 273.15;
      //2 NDVI - Normalized Difference vegetation Index - based on this custom script: https://custom-scripts.sentinel-hub.com/sentinel-3/ndvi/
      var NDVIi = (B17i - B08i) / (B17i + B08i);
      //3 PV - proportional vegetation
      var PVi = Math.pow((NDVIi - NDVIs) / (NDVIv - NDVIs), 2);
      //4 LSE land surface emmisivity
      var LSEi = LSEcalc(NDVIi, PVi);
      //5 LST
      var LSTi = S8BTi / (1 + ((bCent * S8BTi) / rho) * Math.log(LSEi));

      ////temporary calculation
      //avg
      LSTavg = LSTavg + LSTi;
      //max
      if (LSTi > LSTmax) {
        LSTmax = LSTi;
      }
      //array
      LSTarray.push(LSTi);
    } else {
      // image NOT ok
      ++reduceNavg;
    }
  }
  // correct N value if some images have errors and are not analysed
  N = N - reduceNavg;

  // calc final avg value
  LSTavg = LSTavg / N;

  // calc final stdev value
  for (let i = 0; i < LSTarray.length; i++) {
    LSTstd = LSTstd + Math.pow(LSTarray[i] - LSTavg, 2);
  }
  LSTstd = Math.pow(LSTstd / (LSTarray.length - 1), 0.5);

  // WHICH LST to output, it depends on option variable: 0 for one image analysis (OE Browser); MULTI-TEMPORAL: 0->avg; 1->max; 2->stdev
  let outLST = option == 0 ? LSTavg : option == 1 ? LSTmax : LSTstd;

  //// output to image
  return viz.process(outLST);
}Evaluate and Visualize
| Timelapse (2023) of Land Surface Temperature in Sicily during the 2023 heatwave |
|---|
 |
General description of the script
This script shows Land Surface Temperature by using SLSTR data from Sentinel-3. The SLSTR visualization in EO Browser or Copernicus Browser shows Brightness Temperatures in Kelvin based on the reflectance values of the thermal infrared bands. However, these have to be adjusted based on the estimated emissivity of the surface to calculate local Land Surface Temperature. The Custom Script Repository already contains a popular script for Land Surface Temperature visualization based on Landsat-8 OLI and TIRS data, performing the correction of the thermal infrared brightness temperatures using NDVI calculated from the same image. Luckily, Sentinel-3 also allows calculation of thermal infrared brightness temperature based on SLSTR and NDVI based on OLI bands. Additionally, Sentinel-3 has spectral bands that correspond relatively closely to the Landsat-8 bands used by the Land Surface Temperature Script
| Landsat Band | Landsat Band centre | Sentinel-3 Band | Sentinel-3 Band centre | colour or region |
|---|---|---|---|---|
| TIRS B10 | 10895 nm | SLSTR S08 | 10854 nm | Thermal Infrared |
| OLI B03 | 561.5 nm | OLCI B06 | 560 nm | Green |
| OLI B04 | 654.5 nm | OLCI B08 | 665 nm | Red |
| OLI B05 | 865 nm | OLCI B17 | 865 nm | Near Infrared |
How to use the script
- In Sentinel Hub EO Browser or Copernicus Browser, select “Sentinel-3” as your data source and browse to your date and location of interest. At this step, it doesn’t matter whether you select SLSTR or OLCI.
- On the “visualize” tab, choose “Custom”, and “Custom Script”
- On the “Custom Script” tab, select “use additional datasets (advanced)”. The primary dataset will automatically be the one you selected in step 1. You can keep the default alias.
- From the “additional datasets” dropdown menu, select the other Sentinel-3 dataset (SLSTR or OLCI) and click the + sign. Keep the default alias
- Paste the code of this script into the code window.
-
Click the “Refresh Evalscript” button
- In the script window, you can choose with the “option” parameter whether to output average (option = 0), maximum (option = 1) or Standard deviation (option = 2) of the land surface temperature. If you are looking at a single image, choose 0. If you want to look at a timespan, click “Timespan” at the top right of the panel beside the date selector, and set start and end times. Take care to use a timespan with relatively low cloud cover (<5%>).
- Set minimum and maximum temperatures for the colour ramp. This will decide what temperature you see as white (hot) and black (cold).
- If you want, you can also adjust the NDVI value limits for bare soil and vegetation (NDVIs and NDVIv), currently the script uses global values and the emissivity and surface values for various land covers. These were set based on local case studies in the literature.
Limitations and typical problems:
- The script does not contain any cloud detection - please use the True Colour visualization to check for clouds. Clouds will turn up as colder (darker) pixels in the image.
- These Land Surface Temperature values are not calibrated or tested in any way. The emissivity figures for the individual land cover classes would probably benefit from fine tuning.
Description of representative images
| Land Surface Temperatures in Western Hungary under heatwave conditions on 16 August 2022 |
|---|
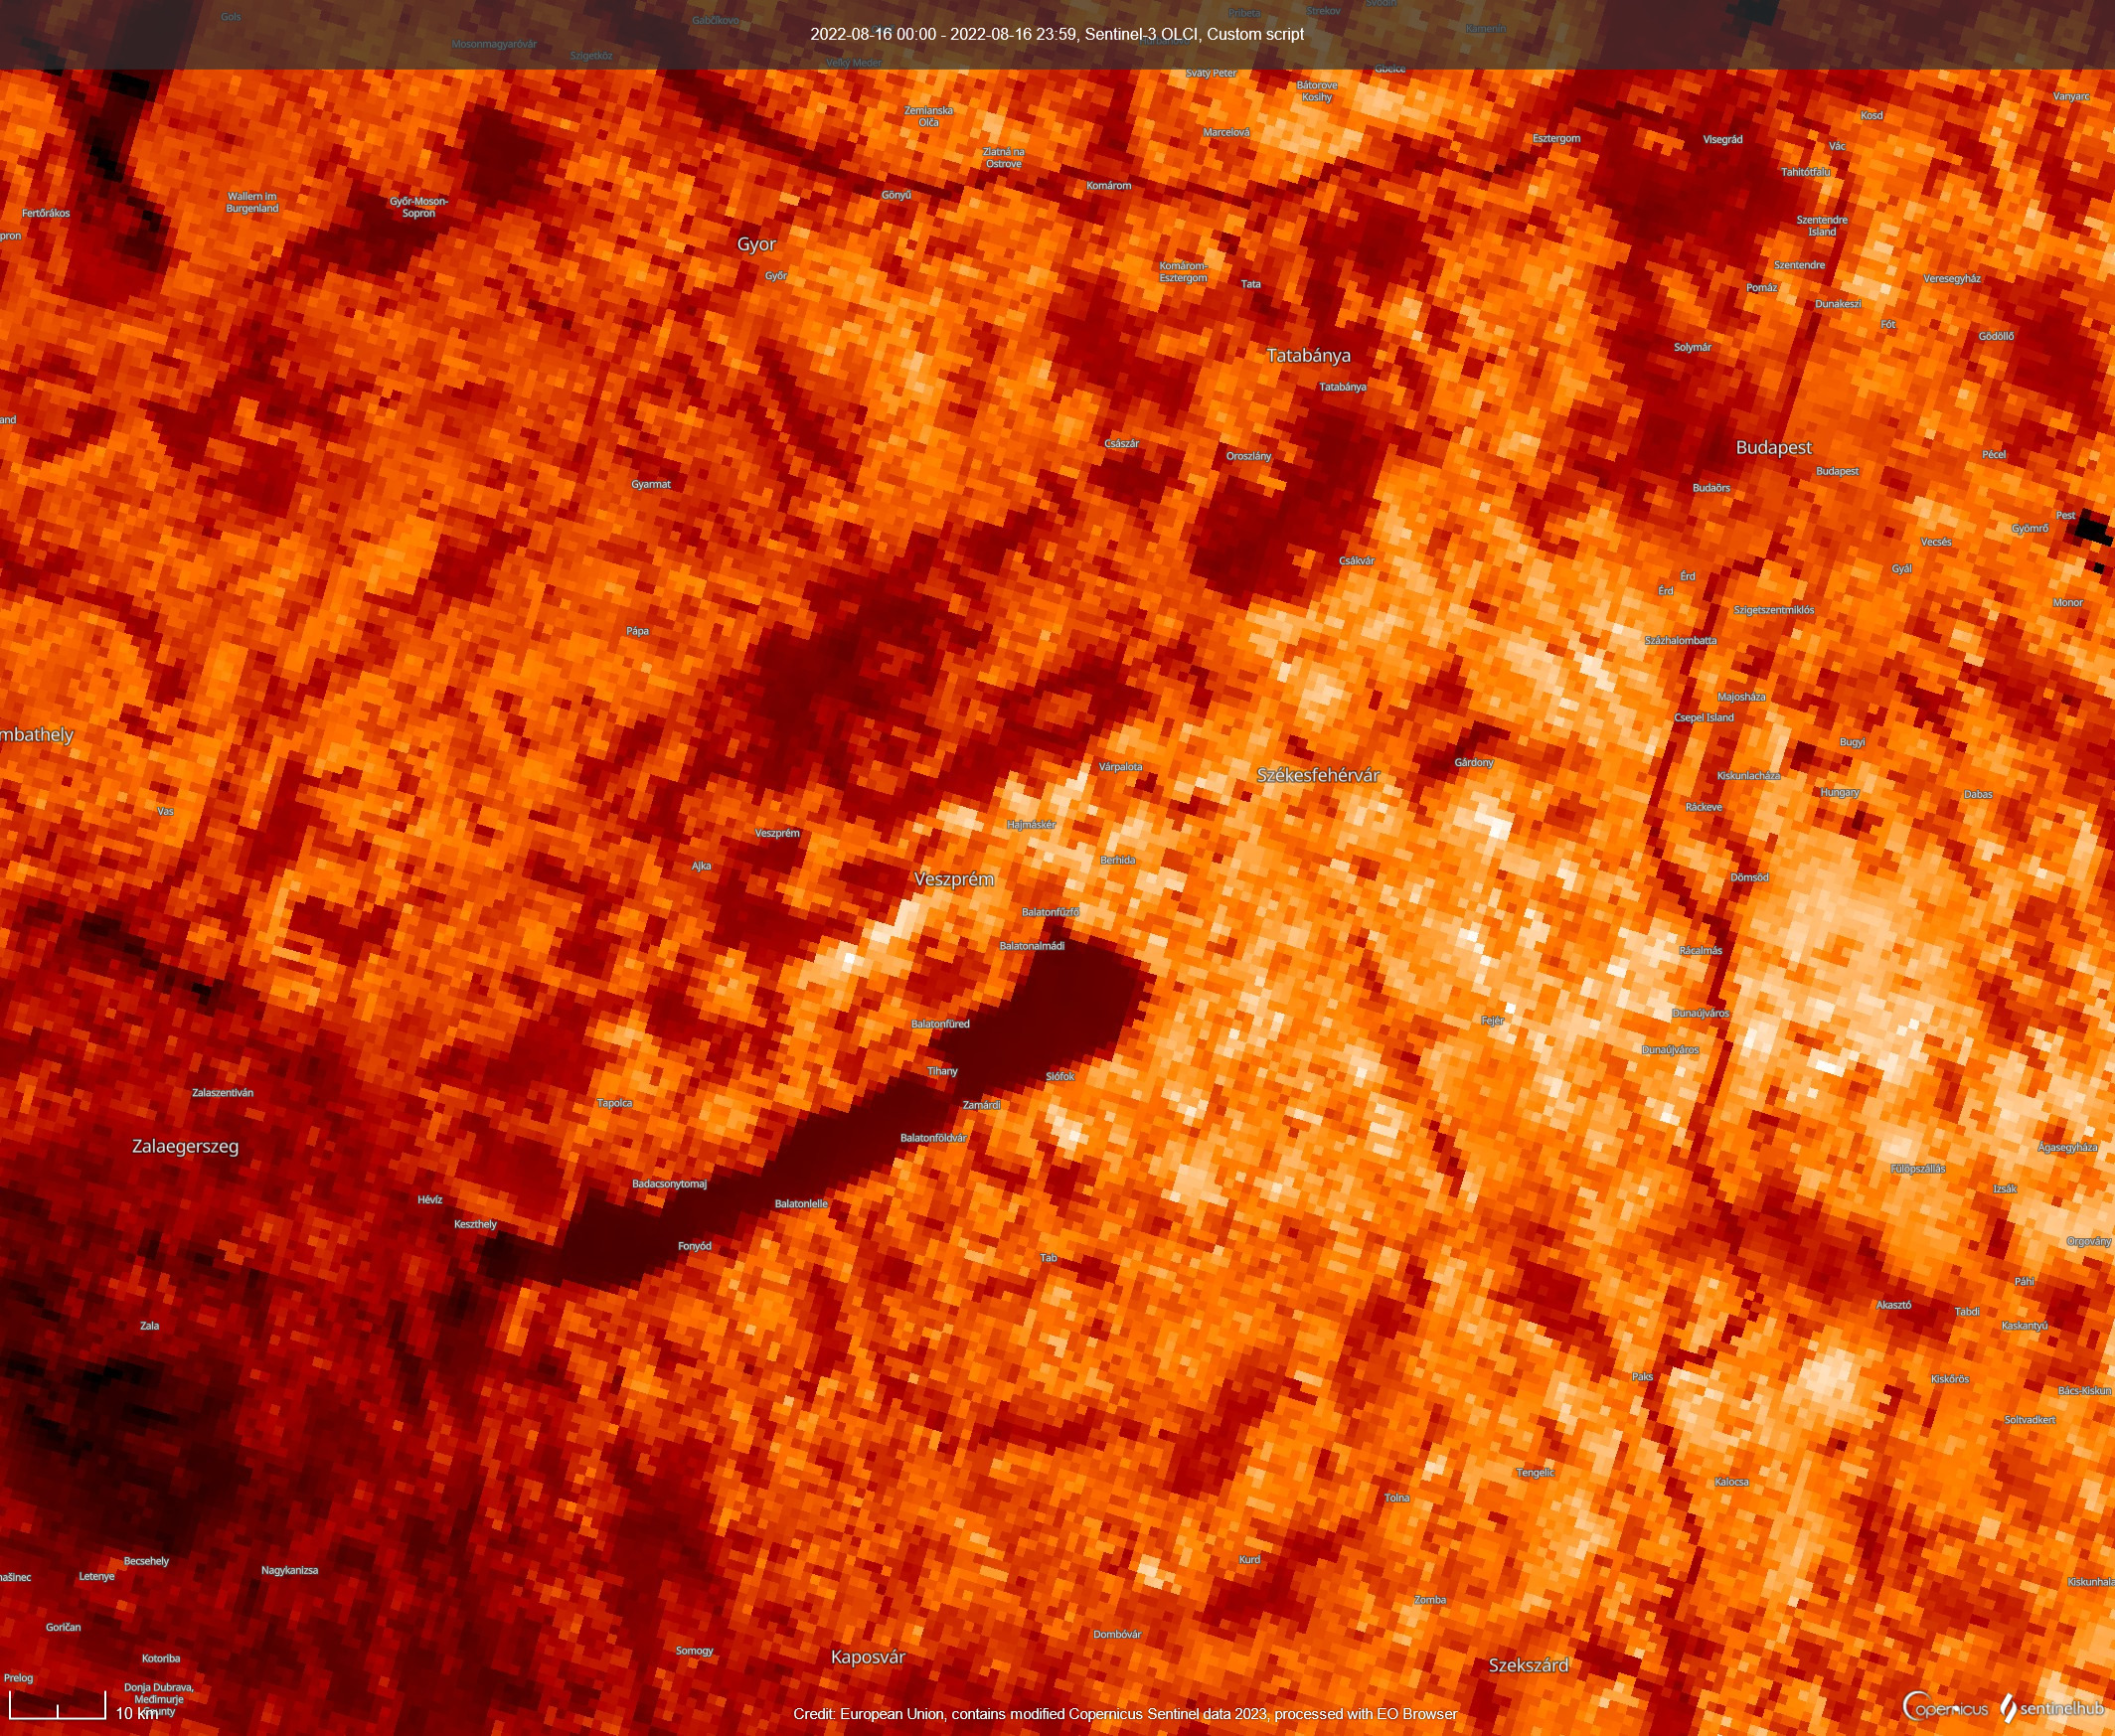 |
On this image, the colour scale is stretched between 15 and 40 °C. Sentinel-3 overpasses are typically around 10:00, so not the hottest time of the day, yet already temperatures around 40°C can be observed especially in the lowland agricultural areas. Forests and especially lakes and rivers are substantially cooler. The coldest spots are small clouds - in these cases the sensor images the temperature of the cloud and not the land surface.
References
- Land Surface Temperature Mapping Script for Landsat 8, by Mohor Gartner - For technical/scientific references, please see the bibliography of this script.