OTCI - OLCI terrestrial chlorophyll index
// Sentinel-3 OTCI - OLCI terrestrial chlorophyll index
var OTCI = (B12 - B11) / (B11 - B10);
return colorBlend
    (OTCI,
        [ 0, 1, 1.8, 2.5, 4, 4.5, 5],
        [
            [0, 0, 0.5],
            [0, 0.3, 0.8],
            [1, 0.2, 0.2],
            [1, 0.9, 0],
            [0, 0.8, 0.1],
            [0, 0.6,0.2],
            [1, 1, 1],
      ]);
//VERSION=3
const map = [
[0.0, 0x00007d],
[1.0, 0x004ccc],
[1.8, 0xff3333],
[2.5, 0xffe500],
[4.0, 0x00cc19],
[4.5, 0x00cc19],
[5.0, 0xffffff],
];
const visualizer = new ColorRampVisualizer(map);
function setup() {
return {
input: ["B10", "B11", "B12", "dataMask"],
output: [
{ id: "default", bands: 4 },
{ id: "index", bands: 1, sampleType: "FLOAT32" },
{ id: "eobrowserStats", bands: 1 },
{ id: "dataMask", bands: 1 },
],
};
}
function evaluatePixel(samples) {
let OTCI = (samples.B12 - samples.B11) / (samples.B11 - samples.B10);
let imgVals = null;
// The library for tiffs works well only if there is only one channel returned.
// So we encode the "no data" as NaN here and ignore NaNs on frontend.
// we restrict the interval to [-10, 10] as it covers most of the value range
const indexVal =
samples.dataMask === 1 && OTCI >= -10 && OTCI <= 10 ? OTCI : NaN;
imgVals = [...visualizer.process(OTCI), samples.dataMask];
return {
default: imgVals,
index: [indexVal],
eobrowserStats: [indexVal],
dataMask: [samples.dataMask],
};
} Evaluate and Visualize
Description
OTCI, the Terrestrial Chlorophyll Index, can be used to assess chlorophyll content over land to monitor vegetation condition and health. It is produced globally at 300m spatial resolution from OLCI data on the Sentinel 3 mission. The theoretical basis document on OTCI is available here..
Blue colors display extremely low OTCI values. They usually signify water, sand or snow. Extremely high values, displayed with white, usually suggest the absence of chlorophyll as well. They generally represent either bare ground, rock or clouds. The chlorophyll values in between range from red (low chlorophyll values) to dark green (high chlorophyll values) and can be used to determine vegetation health.
Description of representative images
OTCI in Europe, acquired on 30.6.2019. 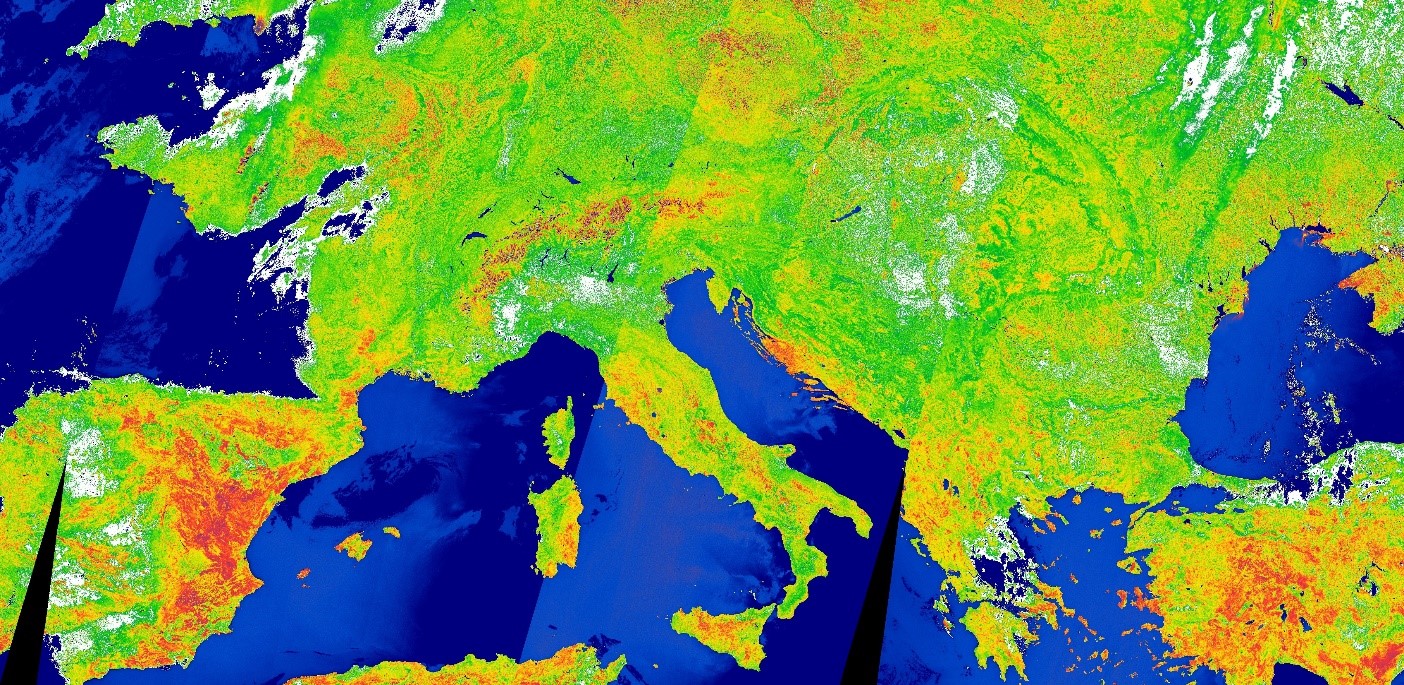
Contributors:
Monja Sebela