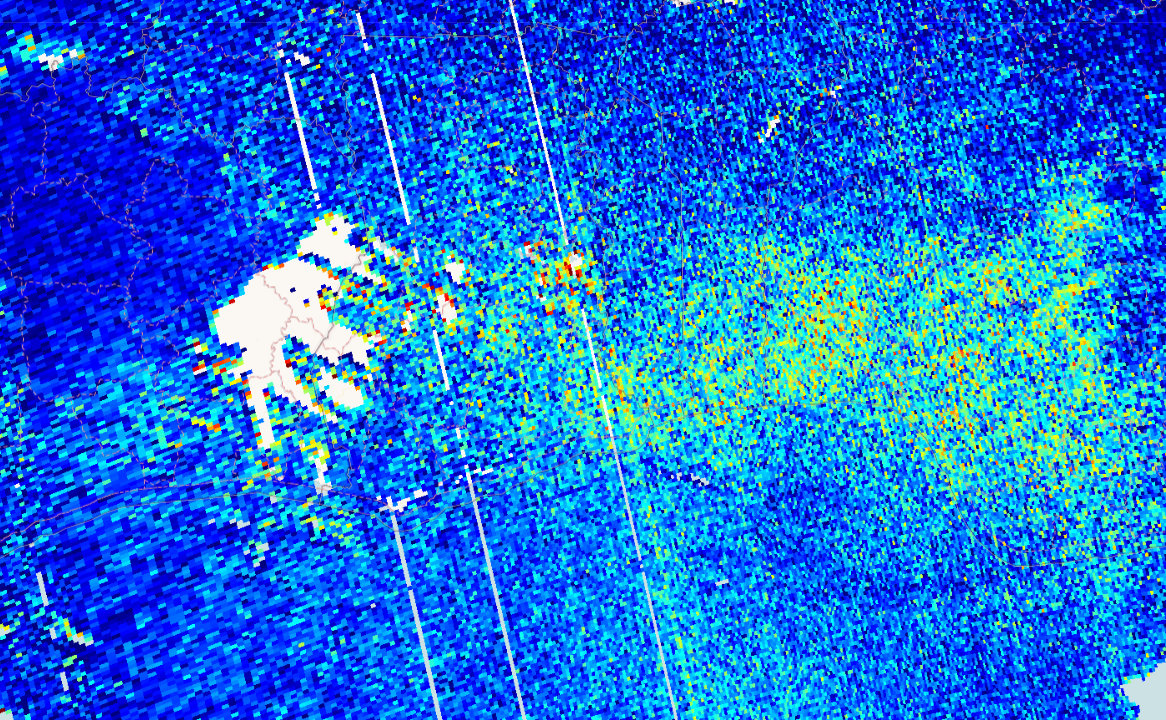
Sentinel-5P Formaldehyde - HCHO
//VERSION=3
const band = "HCHO";
var minVal = 0.0;
var maxVal = 0.001;

function setup() {
  return {
    input: [band, "dataMask"],
    output: {
      bands: 4,
    },
  };
}

var viz = ColorRampVisualizer.createBlueRed(minVal, maxVal);

function evaluatePixel(samples) {
  let ret = viz.process(samples[band]);
  ret.push(samples.dataMask);
  return ret;
}Evaluate and Visualize
Description
Long term satellite observations of tropospheric formaldehyde (HCHO) are essential to support air quality and chemistry-climate related studies from the regional to the global scale. The seasonal and inter-annual variations of the formaldehyde distribution are principally related to temperature changes and fire events, but also to changes in anthropogenic (human-made) activities. Its lifetime being of the order of a few hours, HCHO concentrations in the boundary layer can be directly related to the release of short-lived hydrocarbons, which mostly cannot be observed directly from space. Measurements are in mol per square meter (mol/ m^2). Learn more here.
Description of representative images
High formaldehyde concentrations over Ghana, 2020-01-24.