Sentinel-2 L2A Quarterly Cloudless Mosaic - NDVI
//VERSION=3

function setup() {
    return {
        input: ["B04", "B08", "dataMask"],
        output: { bands: 4 },
    };
}

const ramp = [
    [-0.5, [0.05, 0.05, 0.05]],
    [-0.2, [0.75, 0.75, 0.75]],
    [-0.1, [0.86, 0.86, 0.86]],
    [0, [0.92, 0.92, 0.92]],
    [0.025, [1, 0.98, 0.8]],
    [0.05, [0.93, 0.91, 0.71]],
    [0.075, [0.87, 0.85, 0.61]],
    [0.1, [0.8, 0.78, 0.51]],
    [0.125, [0.74, 0.72, 0.42]],
    [0.15, [0.69, 0.76, 0.38]],
    [0.175, [0.64, 0.8, 0.35]],
    [0.2, [0.57, 0.75, 0.32]],
    [0.25, [0.5, 0.7, 0.28]],
    [0.3, [0.44, 0.64, 0.25]],
    [0.35, [0.38, 0.59, 0.21]],
    [0.4, [0.31, 0.54, 0.18]],
    [0.45, [0.25, 0.49, 0.14]],
    [0.5, [0.19, 0.43, 0.11]],
    [0.55, [0.13, 0.38, 0.07]],
    [0.6, [0.06, 0.33, 0.04]],
    [1, 0, 0.27, 0],
];

const visualizer = new ColorRampVisualizer(ramp);

function evaluatePixel(samples) {
    let val = index(samples.B08, samples.B04);
    let imgVals = visualizer.process(val);
    return imgVals.concat(samples.dataMask)
}
//VERSION=3
function setup() {
return {
input: ["B04", "B08", "dataMask"],
output: [
{ id: "default", bands: 4 },
{ id: "index", bands: 1, sampleType: "FLOAT32" },
{ id: "eobrowserStats", bands: 1, sampleType: "FLOAT32" },
{ id: "dataMask", bands: 1 }
]
};
}
const ramp = [
[-0.5, [0.05, 0.05, 0.05]],
[-0.2, [0.75, 0.75, 0.75]],
[-0.1, [0.86, 0.86, 0.86]],
[0, [0.92, 0.92, 0.92]],
[0.025, [1, 0.98, 0.8]],
[0.05, [0.93, 0.91, 0.71]],
[0.075, [0.87, 0.85, 0.61]],
[0.1, [0.8, 0.78, 0.51]],
[0.125, [0.74, 0.72, 0.42]],
[0.15, [0.69, 0.76, 0.38]],
[0.175, [0.64, 0.8, 0.35]],
[0.2, [0.57, 0.75, 0.32]],
[0.25, [0.5, 0.7, 0.28]],
[0.3, [0.44, 0.64, 0.25]],
[0.35, [0.38, 0.59, 0.21]],
[0.4, [0.31, 0.54, 0.18]],
[0.45, [0.25, 0.49, 0.14]],
[0.5, [0.19, 0.43, 0.11]],
[0.55, [0.13, 0.38, 0.07]],
[0.6, [0.06, 0.33, 0.04]],
[1, 0, 0.27, 0],
];
const visualizer = new ColorRampVisualizer(ramp);
function evaluatePixel(samples) {
let val = index(samples.B08, samples.B04);
const imgVals = visualizer.process(val);
// The library for tiffs works well only if there is only one channel returned.
// So we encode the "no data" as NaN here and ignore NaNs on frontend.
const indexVal = samples.dataMask === 1 ? val : NaN;
return {
default: imgVals.concat(samples.dataMask),
index: [indexVal],
eobrowserStats: [val],
dataMask: [samples.dataMask]
};
}//VERSION=3
function setup() {
return {
input: ["B04", "B08"],
output: {
bands: 1,
sampleType: "FLOAT32"
}
};
}
function evaluatePixel(samples) {
return [index(samples.B08, samples.B04)]
}Evaluate and Visualize
Collection Access
Sentinel-2 L2A Quarterly Cloudless Mosaic is one of the Sentinel-2 products, that is offered in Copernicus Data Space Ecosystem. The data is accessible via Copernicus Browser. To access the data, you need a Copernicus Data Space Ecosystem account, and then either create a Sentinel Hub Process API request to the collection or to visualise the data via Copernicus Browser. The collection ID is 5460de54-082e-473a-b6ea-d5cbe3c17cca, and the collection type is byoc-5460de54-082e-473a-b6ea-d5cbe3c17cca.
General description
The well known and widely used NDVI is a simple, but effective index for quantifying green vegetation. It normalizes green leaf scattering in Near Infra-red wavelengths with chlorophyll absorption in red wavelengths.
The value range of the NDVI is -1 to 1. Negative values of NDVI (values approaching -1) correspond to water. Values close to zero (-0.1 to 0.1) generally correspond to barren areas of rock, sand, or snow. Low, positive values represent shrub and grassland (approximately 0.2 to 0.4), while high values indicate temperate and tropical rainforests (values approaching 1). It is a good proxy for live green vegetation; see [1] for details.
The normalized difference vegetation index, abbreviated NDVI, is calculated using near infrared and red wavelengths.
NDVI = (NIR - RED) / (NIR + RED)
For Sentinel-2, the NDVI is calculated using NIR band 5 and red band 4:
NDVI = (B08 - B04) / (B08 + B04)
See also this page.
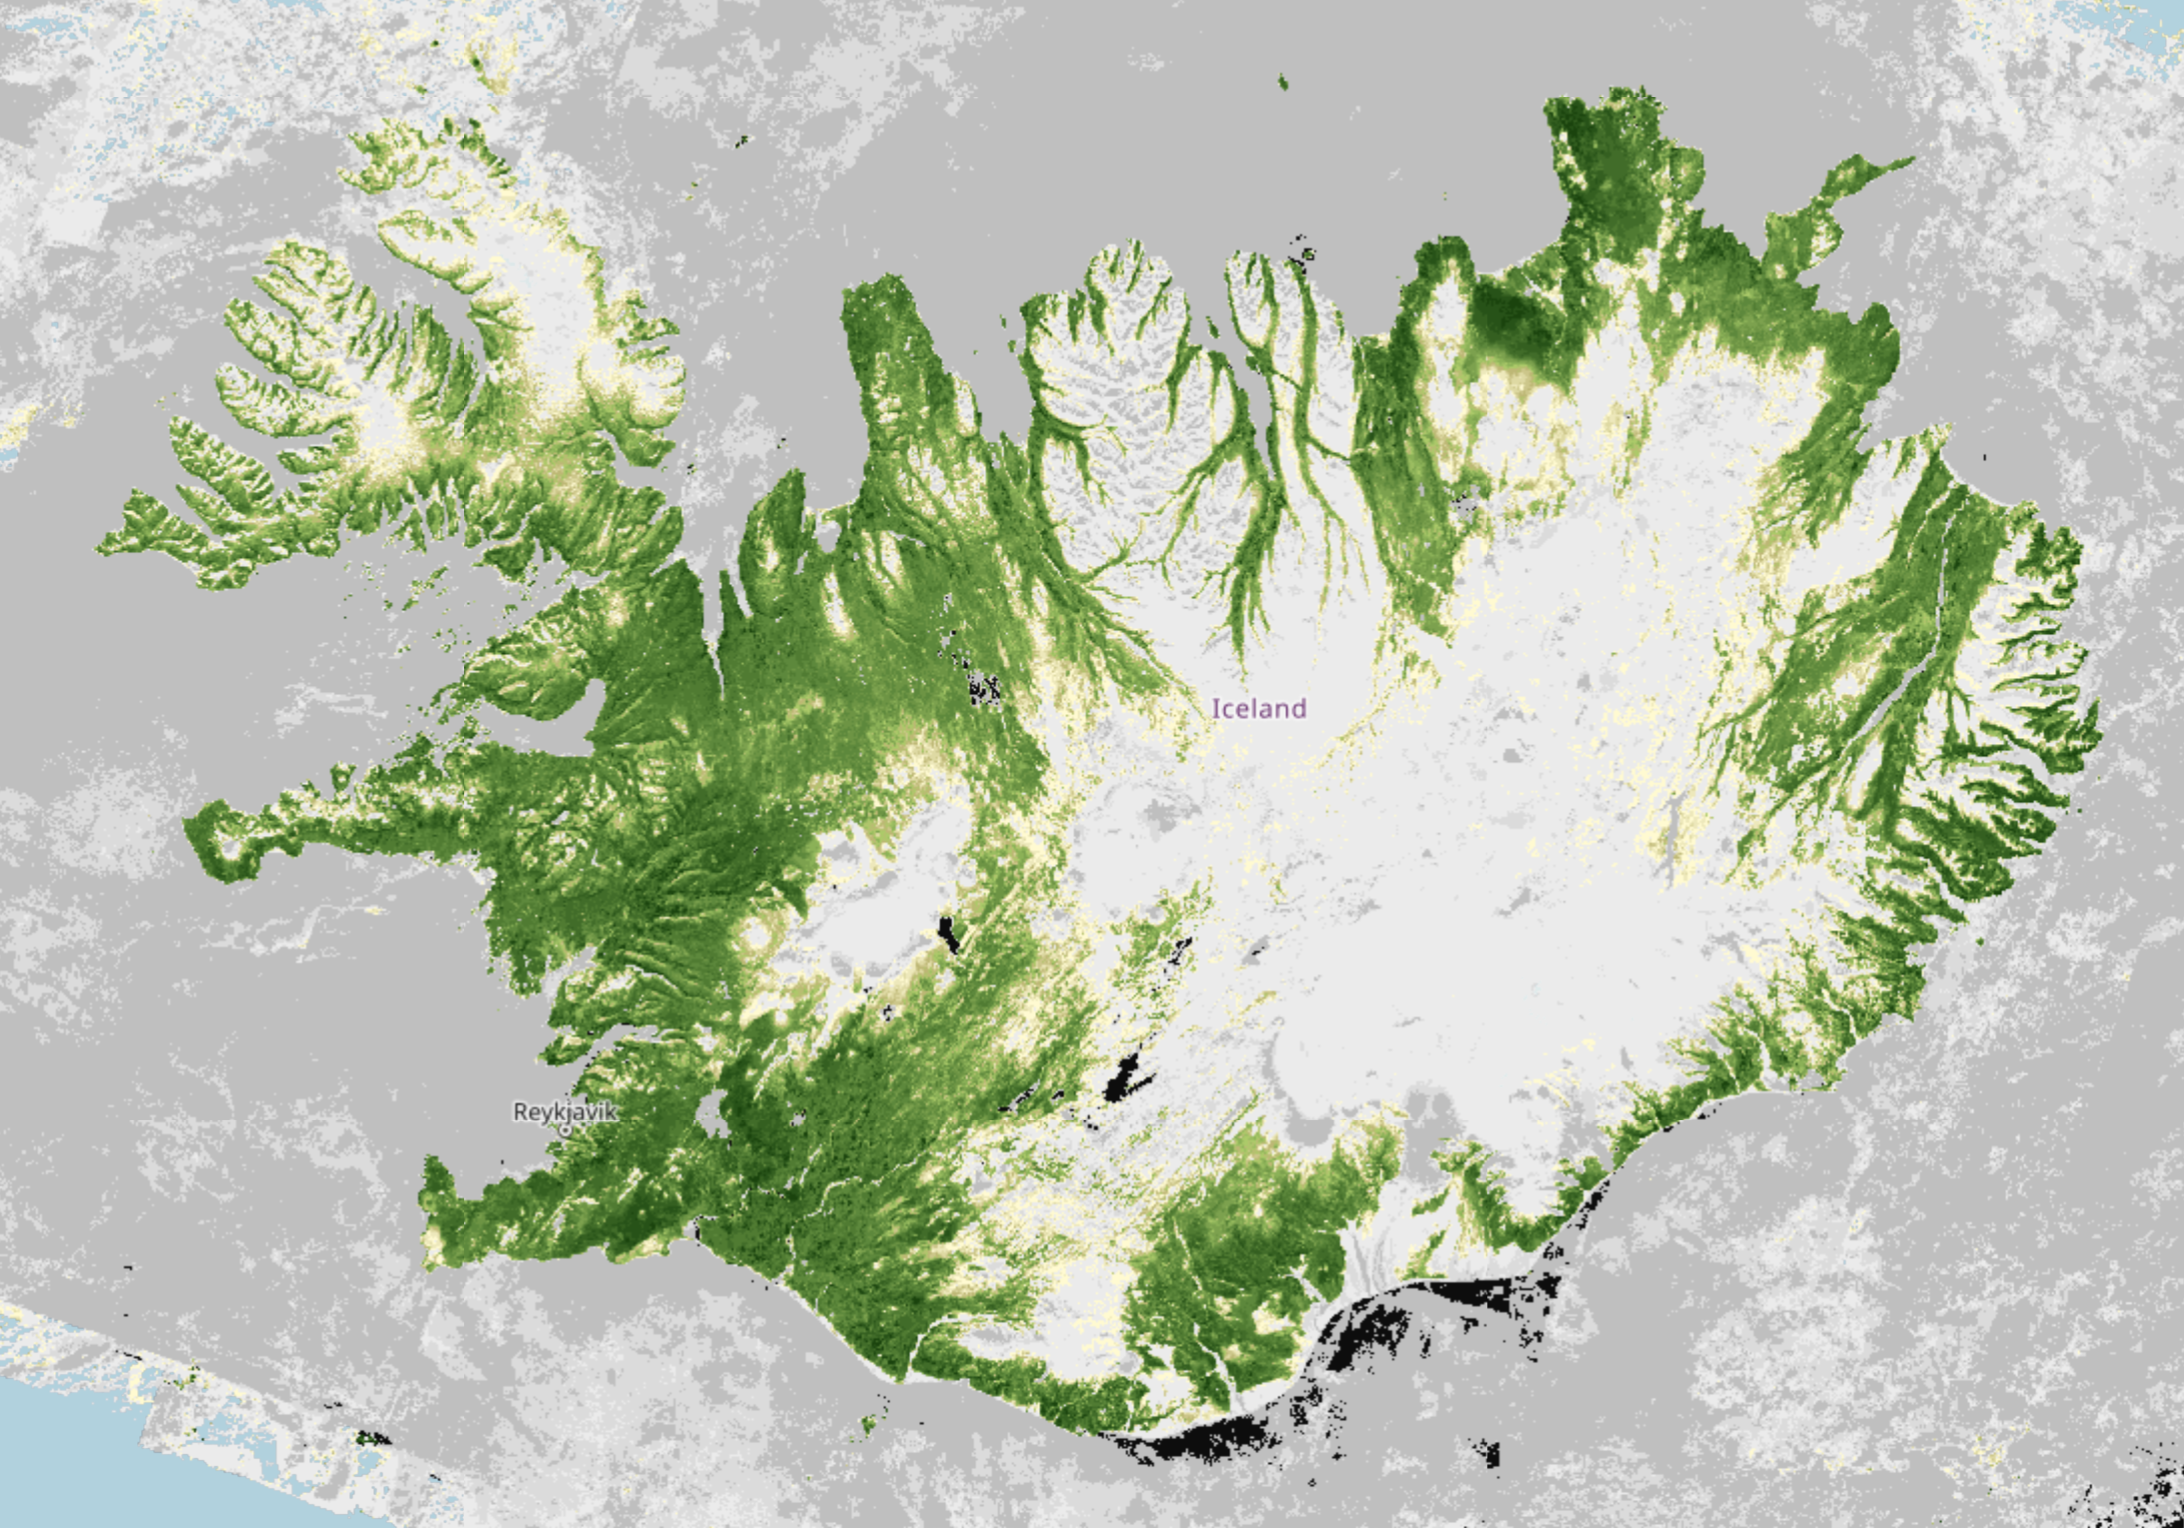
Description of representative images
NDVI of Iceland, 01.10.2023.