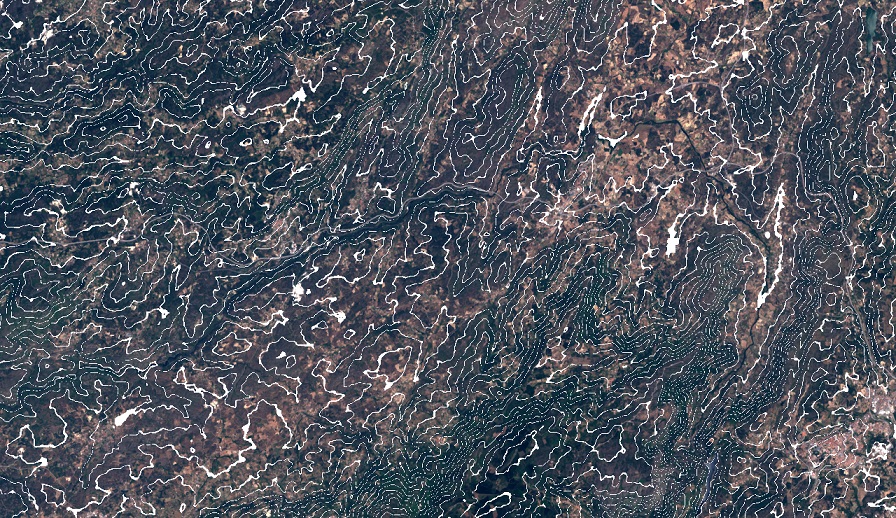
DEM Contour Lines Over Landsat 8
//VERSION=3
//Author: Monja B. Šebela

function setup() {
  return {
  	input: [
    	{datasource: "L8L1C", bands:["B04", "B03", "B02"]},
    	{datasource: "DEM", bands:["DEM"]}],
  	output: [
    	{id: "default", bands: 3}
  	]
  };
}

function evaluatePixel(samples, inputData, inputMetadata, customData, outputMetadata){
    var L8 = samples.L8L1C[0]
    var DEMM = samples.DEM[0]
    var DEM = DEMM.DEM

    var d = DEM;
    if (d % 50 < 4) {
      return{
        default: [1,1,1]
      }
    }
    else{
      return{
        default: [(5*L8.B04)-0.2, (5*L8.B03)-0.2, (5*L8.B02)-0.2]
      }
    }
}Authors
Author of the datafusion script:
- Monja B. Šebela
Authors of the DEM contour line script:
- Marko Repše
- Peter Gabrovšek
Evaluate and visualize
General description of the script
This script uses DEM to calculate contour lines and displays them over Landsat-8 true color image. The contour lines can be modified in color, interval and width. The contour lines script can be found here.
Description of representative images
Contour lines over L8